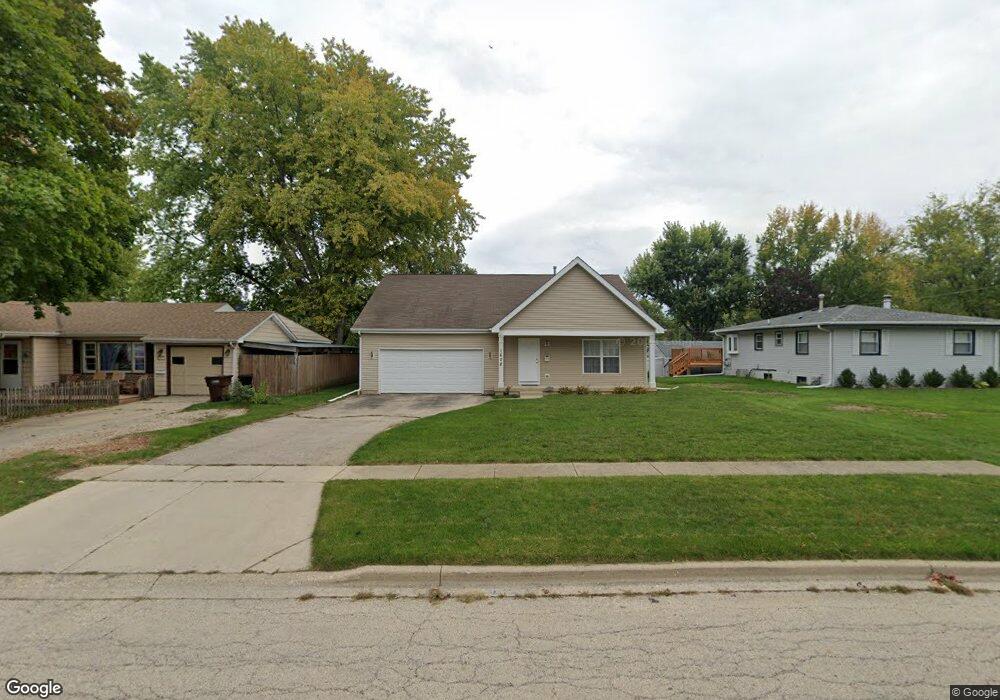
1608 Walnut Dr Woodstock, IL 60098
Estimated Value: $244,000 - $274,000
2
Beds
2
Baths
1,495
Sq Ft
$170/Sq Ft
Est. Value
About This Home
This home is located at 1608 Walnut Dr, Woodstock, IL 60098 and is currently estimated at $254,791, approximately $170 per square foot. 1608 Walnut Dr is a home located in McHenry County with nearby schools including Mary Endres Elementary School, Northwood Middle School, and Woodstock North High School.
Ownership History
Date
Name
Owned For
Owner Type
Purchase Details
Closed on
Dec 29, 2011
Sold by
Secretary Of Housing & Urban Development
Bought by
Rivera Armando Valdes
Current Estimated Value
Home Financials for this Owner
Home Financials are based on the most recent Mortgage that was taken out on this home.
Original Mortgage
$97,045
Outstanding Balance
$66,499
Interest Rate
3.97%
Mortgage Type
FHA
Estimated Equity
$188,292
Purchase Details
Closed on
Jun 1, 2011
Sold by
Castaneda
Bought by
The Secretary Of Housing & Urban Develop
Purchase Details
Closed on
Jun 17, 2005
Sold by
Toepper Richard A and Toepper Christina D
Bought by
Castaneda Luis and Flores Humberto
Home Financials for this Owner
Home Financials are based on the most recent Mortgage that was taken out on this home.
Original Mortgage
$216,601
Interest Rate
5.82%
Mortgage Type
FHA
Create a Home Valuation Report for This Property
The Home Valuation Report is an in-depth analysis detailing your home's value as well as a comparison with similar homes in the area
Home Values in the Area
Average Home Value in this Area
Purchase History
| Date | Buyer | Sale Price | Title Company |
|---|---|---|---|
| Rivera Armando Valdes | $99,000 | Chicago Title | |
| The Secretary Of Housing & Urban Develop | $248,371 | None Available | |
| Castaneda Luis | $220,000 | Ut |
Source: Public Records
Mortgage History
| Date | Status | Borrower | Loan Amount |
|---|---|---|---|
| Open | Rivera Armando Valdes | $97,045 | |
| Previous Owner | Castaneda Luis | $216,601 |
Source: Public Records
Tax History Compared to Growth
Tax History
| Year | Tax Paid | Tax Assessment Tax Assessment Total Assessment is a certain percentage of the fair market value that is determined by local assessors to be the total taxable value of land and additions on the property. | Land | Improvement |
|---|---|---|---|---|
| 2024 | $5,823 | $62,592 | $10,703 | $51,889 |
| 2023 | $5,658 | $57,240 | $9,788 | $47,452 |
| 2022 | $5,019 | $48,100 | $8,795 | $39,305 |
| 2021 | $4,785 | $44,753 | $8,183 | $36,570 |
| 2020 | $4,253 | $39,064 | $7,759 | $31,305 |
| 2019 | $4,102 | $36,780 | $7,305 | $29,475 |
| 2018 | $3,913 | $34,506 | $6,853 | $27,653 |
| 2017 | $3,857 | $32,385 | $6,432 | $25,953 |
| 2016 | $3,904 | $30,402 | $6,038 | $24,364 |
| 2013 | -- | $30,119 | $5,982 | $24,137 |
Source: Public Records
Map
Nearby Homes
- 1626 Wheeler St
- 1546 Wheeler St
- 105 Terry Ct
- 1891 Wicker St Unit 3
- Block 153 Joseph St
- 1109 Tappan St
- 1026 Clay St
- 740 Victoria Dr
- 814 Robert Dr
- 935 Marvel Ave
- 841 N Madison St
- 905 Hickory Rd
- 1808 Powers Rd
- 724 Wheeler St
- 908 Hickory Rd
- 631 Mchenry Ave
- 709 Mchenry Ave
- 150 1st St
- 1401 Rhett Place
- 0 Rt 47 & Lucas Rd Unit MRD12293021