
Seller's Agent in 2025
Shannon Donahue
Hayes Realty
(330) 861-8333
1 in this area
43 Total Sales


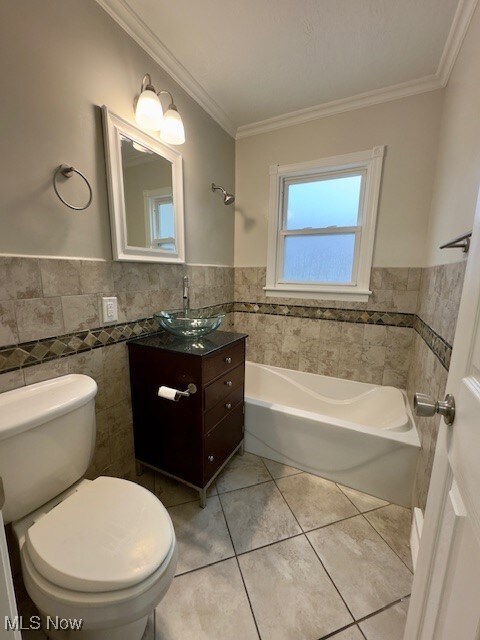
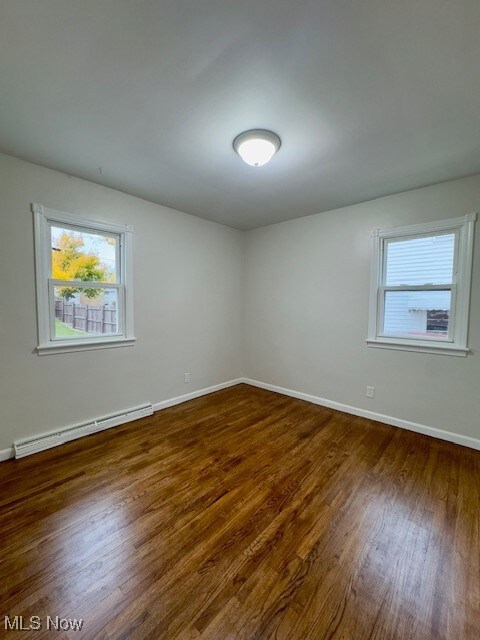

Welcome to this charming Cape Cod home with modern upgrades. Step inside to discover beautiful hardwood floors that gleam throughout the main floor. The spacious living area leads to two inviting first floor bedrooms, each featuring deep closets for ample storage. The first floor bathroom is a true delight, showcasing decorative tiled walls, crown molding, and a relaxing bathtub with a shower. The well appointed kitchen features dark cabinetry, a chic tile backsplash, and ceramic tile flooring. Equipped with modern appliances, including a dishwasher, microwave, and range. The second floor is dedicated to a tranquil master suite that provides privacy and relaxation. This spacious bedroom features a walk-in closet and an en suite bathroom complete with a bathtub and shower combo, a stylish new vanity, and waterproof luxury vinyl flooring. The backyard is equally as impressive. This partially fenced haven includes a detached garage with opener plus an additional storage shed, a two-level deck perfect for entertaining, and a lovely paver patio with a stone fire pit for cozy evenings under the stars. You can enjoy peace of mind with the brand new roof. Don't miss the opportunity to make this home your own! Schedule a viewing today! Agent owned.
Last Agent to Sell the Property
Hayes Realty Brokerage Email: shannon@hayesrealty.com, 330-861-8333 License #2014001893 Listed on: 11/07/2025
| Date | Type | Sale Price | Title Company |
|---|---|---|---|
| Warranty Deed | $210,000 | American Title Solutions | |
| Fiduciary Deed | $80,000 | None Listed On Document | |
| Corporate Deed | $58,600 | Resource Title Agency Inc | |
| Warranty Deed | $109,800 | None Available | |
| Deed | $7,500 | -- | |
| Deed | $54,000 | -- |
| Date | Status | Loan Amount | Loan Type |
|---|---|---|---|
| Open | $179,999 | New Conventional | |
| Previous Owner | $49,810 | New Conventional | |
| Previous Owner | $109,750 | Balloon |
| Date | Event | Price | List to Sale | Price per Sq Ft |
|---|---|---|---|---|
| 12/11/2025 12/11/25 | Sold | $210,000 | +5.1% | $168 / Sq Ft |
| 11/11/2025 11/11/25 | Pending | -- | -- | -- |
| 11/07/2025 11/07/25 | For Sale | $199,900 | -- | $160 / Sq Ft |
| Year | Tax Paid | Tax Assessment Tax Assessment Total Assessment is a certain percentage of the fair market value that is determined by local assessors to be the total taxable value of land and additions on the property. | Land | Improvement |
|---|---|---|---|---|
| 2025 | -- | $47,180 | $9,310 | $37,870 |
| 2024 | -- | $47,180 | $9,310 | $37,870 |
| 2023 | $1,253 | $36,050 | $8,120 | $27,930 |
| 2022 | $1,281 | $36,050 | $8,120 | $27,930 |
| 2021 | $1,697 | $36,050 | $8,120 | $27,930 |
| 2020 | $1,576 | $30,450 | $7,000 | $23,450 |
| 2019 | $1,562 | $30,450 | $7,000 | $23,450 |
| 2018 | $1,543 | $30,450 | $7,000 | $23,450 |
| 2017 | $1,544 | $27,980 | $6,900 | $21,080 |
| 2016 | $1,330 | $24,020 | $6,900 | $17,120 |
| 2015 | $1,265 | $23,630 | $6,900 | $16,730 |
| 2014 | $1,240 | $22,660 | $6,620 | $16,040 |
| 2013 | $606 | $22,660 | $6,620 | $16,040 |
Seller's Agent in 2025
Shannon Donahue
Hayes Realty
(330) 861-8333
1 in this area
43 Total Sales
Buyer's Agent in 2025
Casey Roch
RE/MAX
(330) 697-3403
3 in this area
702 Total Sales
Source: MLS Now
MLS Number: 5170472
APN: 05205041
Disclaimer: Certain information contained herein is derived from information provided by parties other than Homes.com. All information provided is deemed reliable, but is not guaranteed to be accurate and should be independently verified.
![]() IDX information is provided exclusively for personal, non-commercial use, and may not be used for any purpose other than to identify prospective properties consumers may be interested in purchasing. Information is deemed reliable but not guaranteed.
IDX information is provided exclusively for personal, non-commercial use, and may not be used for any purpose other than to identify prospective properties consumers may be interested in purchasing. Information is deemed reliable but not guaranteed.
Ask me questions while you tour the home.