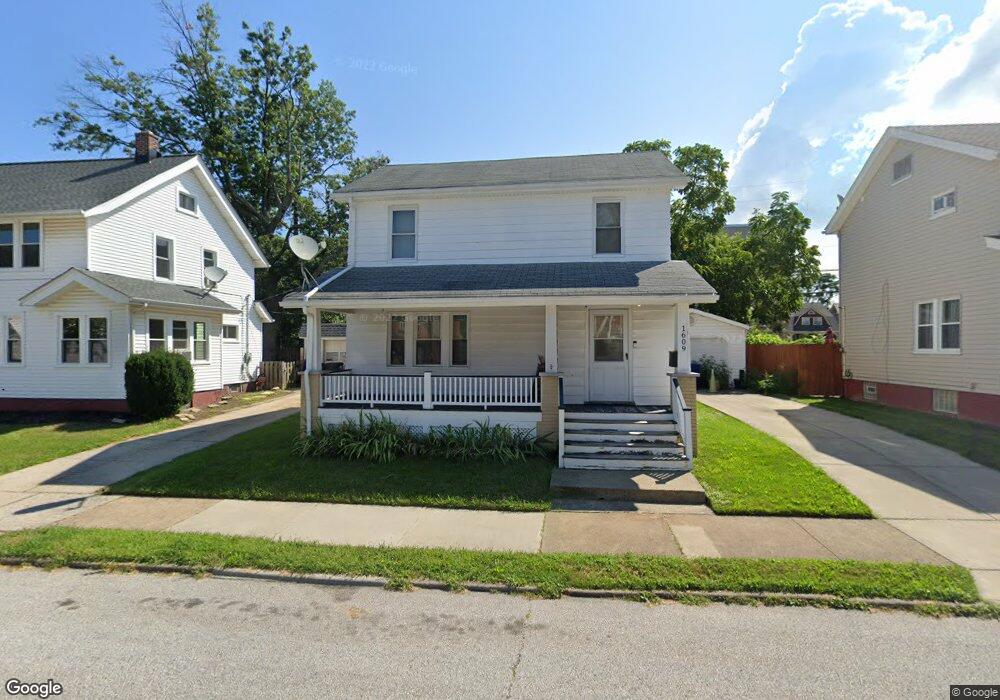
1609 Blossom Park Ave Lakewood, OH 44107
Estimated Value: $277,226 - $317,000
3
Beds
1
Bath
1,168
Sq Ft
$252/Sq Ft
Est. Value
About This Home
This home is located at 1609 Blossom Park Ave, Lakewood, OH 44107 and is currently estimated at $294,307, approximately $251 per square foot. 1609 Blossom Park Ave is a home located in Cuyahoga County with nearby schools including Roosevelt Elementary School, Garfield Middle School, and Lakewood High School.
Ownership History
Date
Name
Owned For
Owner Type
Purchase Details
Closed on
Apr 24, 2001
Sold by
Branchick Frank A
Bought by
Branchick Frank A and Branchick Magdalene
Current Estimated Value
Home Financials for this Owner
Home Financials are based on the most recent Mortgage that was taken out on this home.
Original Mortgage
$106,400
Interest Rate
6.66%
Purchase Details
Closed on
Mar 20, 2001
Sold by
Branchick Frank A
Bought by
Branchick Magdalene
Home Financials for this Owner
Home Financials are based on the most recent Mortgage that was taken out on this home.
Original Mortgage
$106,400
Interest Rate
6.66%
Purchase Details
Closed on
May 28, 1986
Sold by
Gibson Frances B
Bought by
Branchick Frank A
Purchase Details
Closed on
May 14, 1984
Sold by
Gibson Walter J and Gibson Frances B
Bought by
Gibson Frances B
Purchase Details
Closed on
Jan 1, 1975
Bought by
Gibson Walter J and Gibson Frances B
Create a Home Valuation Report for This Property
The Home Valuation Report is an in-depth analysis detailing your home's value as well as a comparison with similar homes in the area
Home Values in the Area
Average Home Value in this Area
Purchase History
| Date | Buyer | Sale Price | Title Company |
|---|---|---|---|
| Branchick Frank A | -- | -- | |
| Branchick Magdalene | -- | -- | |
| Branchick Frank A | $50,500 | -- | |
| Gibson Frances B | -- | -- | |
| Gibson Walter J | -- | -- |
Source: Public Records
Mortgage History
| Date | Status | Borrower | Loan Amount |
|---|---|---|---|
| Closed | Branchick Magdalene | $106,400 |
Source: Public Records
Tax History Compared to Growth
Tax History
| Year | Tax Paid | Tax Assessment Tax Assessment Total Assessment is a certain percentage of the fair market value that is determined by local assessors to be the total taxable value of land and additions on the property. | Land | Improvement |
|---|---|---|---|---|
| 2024 | $5,459 | $84,980 | $16,415 | $68,565 |
| 2023 | $4,623 | $61,600 | $13,860 | $47,740 |
| 2022 | $4,653 | $61,600 | $13,860 | $47,740 |
| 2021 | $4,605 | $61,600 | $13,860 | $47,740 |
| 2020 | $4,084 | $47,740 | $10,750 | $37,000 |
| 2019 | $4,003 | $136,400 | $30,700 | $105,700 |
| 2018 | $3,997 | $47,740 | $10,750 | $37,000 |
| 2017 | $3,442 | $37,350 | $8,230 | $29,120 |
| 2016 | $3,418 | $36,930 | $8,230 | $28,700 |
| 2015 | $3,380 | $36,930 | $8,230 | $28,700 |
| 2014 | $3,380 | $35,490 | $7,910 | $27,580 |
Source: Public Records
Map
Nearby Homes
- 1593 Marlowe Ave
- 1545 Marlowe Ave
- 1514 Olivewood Ave
- 1675 Roosevelt Ave
- 1669 Robinwood Ave
- 1532 Parkwood Rd
- 1576 Wyandotte Ave
- 1415 Olivewood Ave Unit 17
- 1458 Wyandotte Ave
- 1539 Elbur Ave
- 2078 Baxterly Ave
- 1463 Wyandotte Ave
- 1480 Warren Rd Unit 313
- 1480 Warren Rd
- 1594 Victoria Ave
- 1605 Lewis Dr
- 13532 Elbur Ln
- 2100 Wascana Ave
- 14404 Bayes Ave
- 1503 Chesterland Ave
- 1615 Blossom Park Ave
- 1605 Blossom Park Ave
- 1619 Blossom Park Ave
- 1597 Blossom Park Ave
- 1608 Blossom Park Ave
- 1612 Blossom Park Ave
- 1602 Blossom Park Ave
- 1618 Blossom Park Ave
- 1598 Blossom Park Ave
- 1593 Blossom Park Ave
- 1623 Blossom Park Ave
- 1604 Robinwood Ave
- 1600 Robinwood Ave
- 1591 Olivewood Ave
- 1597 Olivewood Ave
- 1585 Olivewood Ave
- 1592 Blossom Park Ave
- 1608 Robinwood Ave
- 1601 Olivewood Ave
- 1622 Blossom Park Ave