L
Landlord's Agent in 2025
Laurie Clevenger
HANK BRILL PROPERTIES LLC
(941) 228-5951
7 Total Sales

Estimated Value: $264,000 - $337,000
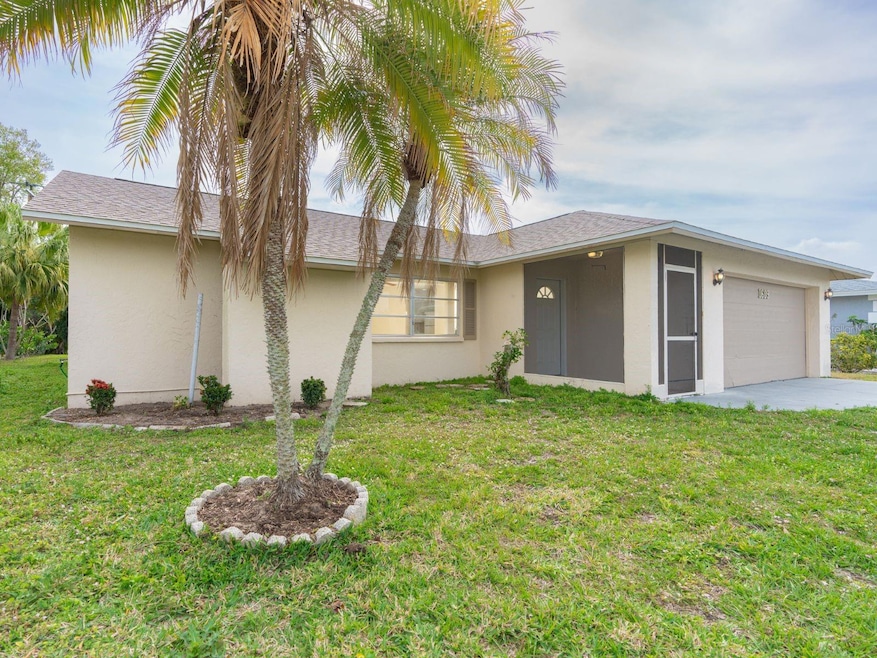
A very nice updated Venice Gardens Home! Experience the convenience of this 2-bedroom, 2-bathroom home in the Venice Gardens/Jacaranda West area of Venice. Have peace of mind with a brand-new roof installed in 2020 and a new A/C unit in 2019. The kitchen and bathrooms underwent recent renovations as well. The entire home underwent newly executed upgrades. The garage of the house includes a washer and dryer, and there is a private yard with green space along the back. For beach enthusiasts, Venice Beach, Caspersen Beach, and the North & South Jetties beckon just a short drive away. Historic downtown Venice & 41 with area retail stores including Walmart, Target, Venice Village Shoppes, TJ Maxx, and more. 685+ credit score to qualify.
Last Agent to Rent the Property
HANK BRILL PROPERTIES LLC Brokerage Phone: 941-474-2882 License #3633279 Listed on: 09/05/2025
Last Renter's Agent
HANK BRILL PROPERTIES LLC Brokerage Phone: 941-474-2882 License #3633279 Listed on: 09/05/2025
| Date | Buyer | Sale Price | Title Company |
|---|---|---|---|
| Cvetkovski George | $90,000 | Chelsea Title Company |
| Date | Event | Price | List to Sale | Price per Sq Ft |
|---|---|---|---|---|
| 12/16/2025 12/16/25 | Rented | $1,699 | 0.0% | -- |
| 12/12/2025 12/12/25 | Under Contract | -- | -- | -- |
| 11/05/2025 11/05/25 | Price Changed | $1,699 | -5.6% | $1 / Sq Ft |
| 10/20/2025 10/20/25 | Price Changed | $1,799 | -5.3% | $1 / Sq Ft |
| 09/05/2025 09/05/25 | For Rent | $1,899 | -4.8% | -- |
| 08/29/2024 08/29/24 | Rented | $1,995 | 0.0% | -- |
| 08/27/2024 08/27/24 | Under Contract | -- | -- | -- |
| 06/26/2024 06/26/24 | For Rent | $1,995 | -- | -- |
| Year | Tax Paid | Tax Assessment Tax Assessment Total Assessment is a certain percentage of the fair market value that is determined by local assessors to be the total taxable value of land and additions on the property. | Land | Improvement |
|---|---|---|---|---|
| 2025 | $3,459 | $230,100 | $84,100 | $146,000 |
| 2024 | $3,327 | $217,699 | -- | -- |
| 2023 | $3,327 | $278,800 | $105,700 | $173,100 |
| 2022 | $3,054 | $251,000 | $102,600 | $148,400 |
| 2021 | $2,535 | $171,200 | $66,700 | $104,500 |
| 2020 | $2,243 | $142,600 | $52,500 | $90,100 |
| 2019 | $2,149 | $138,200 | $52,500 | $85,700 |
| 2018 | $2,233 | $146,700 | $52,000 | $94,700 |
| 2017 | $2,215 | $142,900 | $52,000 | $90,900 |
| 2016 | $2,170 | $141,900 | $40,900 | $101,000 |
| 2015 | $2,006 | $122,600 | $30,600 | $92,000 |
| 2014 | $1,873 | $98,900 | $0 | $0 |
L
Landlord's Agent in 2025
Laurie Clevenger
HANK BRILL PROPERTIES LLC
(941) 228-5951
7 Total Sales
P
Seller's Agent in 2024
Paula brill
HANK BRILL PROPERTIES LLC
(941) 223-6095
14 Total Sales
Source: Stellar MLS
MLS Number: D6143704
APN: 0437-01-0051
Disclaimer: Certain information contained herein is derived from information provided by parties other than Homes.com. All information provided is deemed reliable, but is not guaranteed to be accurate and should be independently verified.
![]() Based on information submitted to the MLS GRID. All data is obtained from various sources and may not have been verified by broker or MLS GRID. Supplied Open House Information is subject to change without notice. All information should be independently reviewed and verified for accuracy. Properties may or may not be listed by the office/agent presenting the information. Some IDX listings have been excluded from this website. IDX information is provided exclusively for personal, non-commercial use, and may not be used for any purpose other than to identify prospective properties consumers may be interested in purchasing. Information is deemed reliable but not guaranteed.
Based on information submitted to the MLS GRID. All data is obtained from various sources and may not have been verified by broker or MLS GRID. Supplied Open House Information is subject to change without notice. All information should be independently reviewed and verified for accuracy. Properties may or may not be listed by the office/agent presenting the information. Some IDX listings have been excluded from this website. IDX information is provided exclusively for personal, non-commercial use, and may not be used for any purpose other than to identify prospective properties consumers may be interested in purchasing. Information is deemed reliable but not guaranteed.
Based on information submitted to the MLS GRID
Listing Information presented by local MLS brokerage: Ten-X - (888)-952-6393
Ask me questions while you tour the home.
