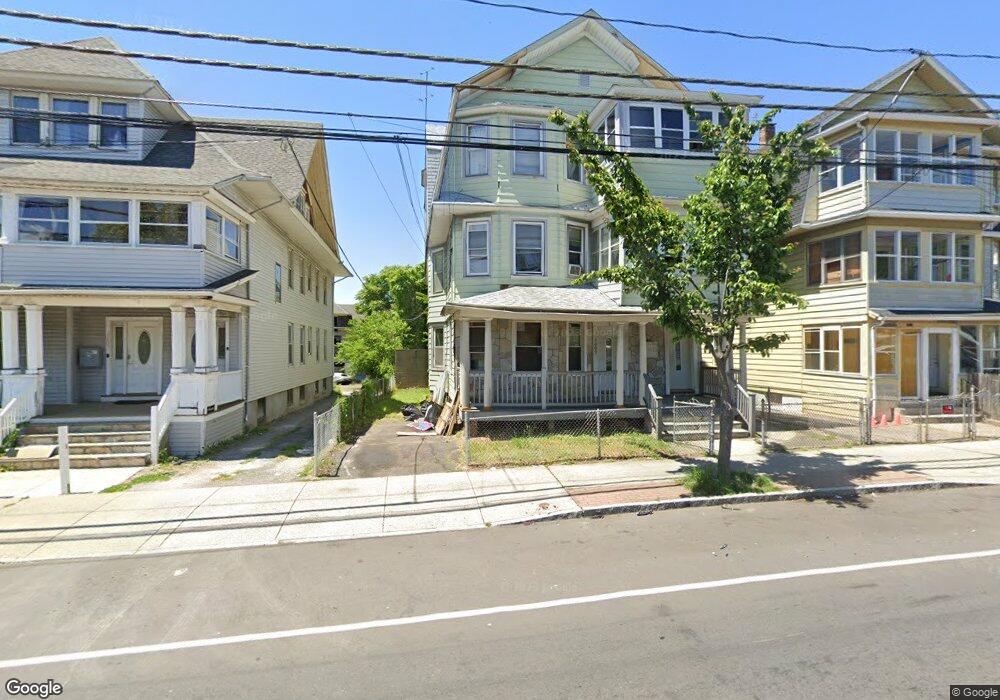
1609 E Main St Bridgeport, CT 06608
East Side Bridgeport NeighborhoodEstimated Value: $314,115 - $584,000
6
Beds
3
Baths
4,190
Sq Ft
$114/Sq Ft
Est. Value
About This Home
This home is located at 1609 E Main St, Bridgeport, CT 06608 and is currently estimated at $476,779, approximately $113 per square foot. 1609 E Main St is a home located in Fairfield County with nearby schools including Beardsley School, Harding High School, and Achievement First Bridgeport Academy Elementary School.
Ownership History
Date
Name
Owned For
Owner Type
Purchase Details
Closed on
Nov 14, 2001
Sold by
Lopez Naomi
Bought by
Plumey Sonia and Trinidad Manuel
Current Estimated Value
Home Financials for this Owner
Home Financials are based on the most recent Mortgage that was taken out on this home.
Original Mortgage
$143,948
Outstanding Balance
$53,068
Interest Rate
6.7%
Mortgage Type
Purchase Money Mortgage
Estimated Equity
$423,711
Purchase Details
Closed on
Oct 1, 1999
Sold by
Norwest Bk Minn Na
Bought by
Lopez Naomi
Purchase Details
Closed on
Dec 31, 1997
Sold by
Mitola Thomas and Mitola Michael
Bought by
Graham James
Create a Home Valuation Report for This Property
The Home Valuation Report is an in-depth analysis detailing your home's value as well as a comparison with similar homes in the area
Home Values in the Area
Average Home Value in this Area
Purchase History
| Date | Buyer | Sale Price | Title Company |
|---|---|---|---|
| Plumey Sonia | $148,400 | -- | |
| Plumey Sonia | $148,400 | -- | |
| Lopez Naomi | $94,000 | -- | |
| Lopez Naomi | $94,000 | -- | |
| Graham James | $57,000 | -- | |
| Mitola Thomas | $12,000 | -- | |
| Graham James | $57,000 | -- |
Source: Public Records
Mortgage History
| Date | Status | Borrower | Loan Amount |
|---|---|---|---|
| Open | Graham James | $143,948 | |
| Closed | Graham James | $143,948 | |
| Previous Owner | Graham James | $25,000 |
Source: Public Records
Tax History
| Year | Tax Paid | Tax Assessment Tax Assessment Total Assessment is a certain percentage of the fair market value that is determined by local assessors to be the total taxable value of land and additions on the property. | Land | Improvement |
|---|---|---|---|---|
| 2025 | $8,439 | $194,216 | $29,926 | $164,290 |
| 2024 | $8,439 | $194,216 | $29,926 | $164,290 |
| 2023 | $8,439 | $194,216 | $29,926 | $164,290 |
| 2022 | $8,439 | $194,216 | $29,926 | $164,290 |
| 2021 | $8,439 | $194,216 | $29,926 | $164,290 |
| 2020 | $8,106 | $150,140 | $14,180 | $135,960 |
| 2019 | $8,106 | $150,140 | $14,180 | $135,960 |
| 2018 | $8,163 | $150,140 | $14,180 | $135,960 |
| 2017 | $8,163 | $150,140 | $14,180 | $135,960 |
| 2016 | $8,163 | $150,140 | $14,180 | $135,960 |
| 2015 | $8,569 | $203,060 | $27,440 | $175,620 |
| 2014 | $8,569 | $203,060 | $27,440 | $175,620 |
Source: Public Records
Map
Nearby Homes
- 744 Park St
- 1218 Kossuth St
- 386-388 Huntington Rd
- 619 Brooks St Unit 621
- 500 Park St
- 502 Berkshire Ave
- 1365 E Main St
- 750 William St
- 1389 Pembroke St
- 690 William St
- 369 Park St
- 142 Palm St
- 274 Park St
- 2034 E Main St
- 2031 E Main St
- 282 Horace St
- 34-40 Hayes St
- 1248 Pembroke St
- 46 York St
- 1220 Pembroke St
- 1617 E Main St
- 44 Autumn St
- 1603 E Main St
- 1591 E Main St
- 38 Autumn St
- 1633 E Main St
- 1573 E Main St
- 43 Autumn St
- 43-45 Autumn St
- 1643 E Main St
- 32 Autumn St
- 32 Autumn St Unit 2
- 37 Autumn St
- 47 Autumn St Unit 2
- 26 Autumn St
- 1565 E Main St
- 1590 E Main St
- 29 Autumn St
- 231 Spring St Unit 3rd Floor
- 1578 E Main St
Your Personal Tour Guide
Ask me questions while you tour the home.