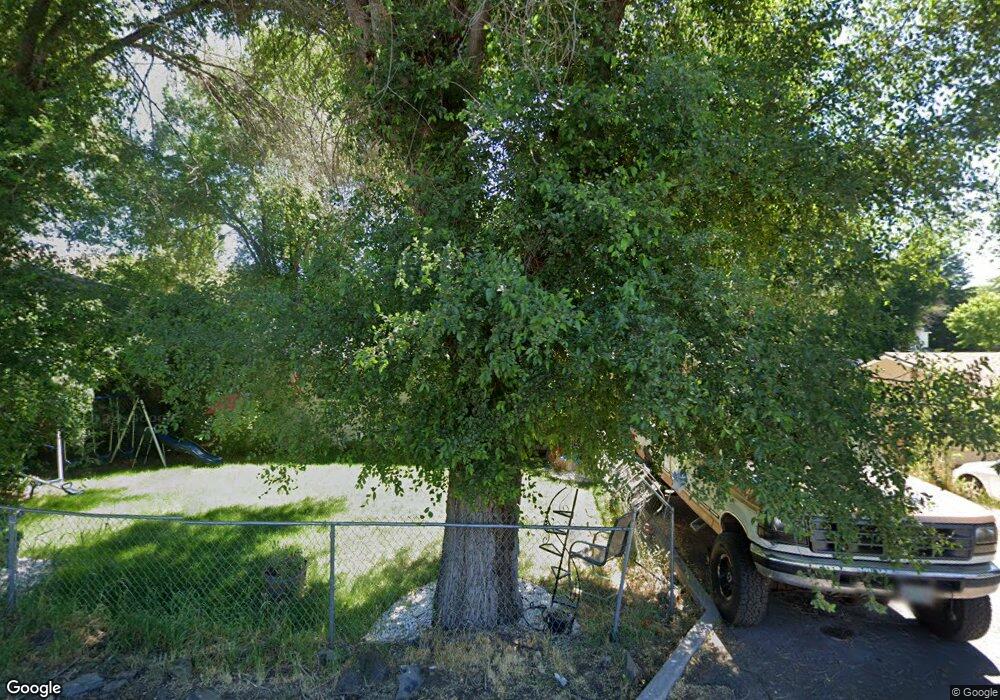
1609 Kane St Klamath Falls, OR 97603
Estimated Value: $318,712 - $333,000
3
Beds
2
Baths
1,544
Sq Ft
$211/Sq Ft
Est. Value
About This Home
This home is located at 1609 Kane St, Klamath Falls, OR 97603 and is currently estimated at $325,856, approximately $211 per square foot. 1609 Kane St is a home located in Klamath County with nearby schools including Shasta Elementary School, Henley Middle School, and Mazama High School.
Ownership History
Date
Name
Owned For
Owner Type
Purchase Details
Closed on
Sep 12, 2024
Sold by
Michel Catherine L and Jones Catherine
Bought by
Jones Catherine and Jones George
Current Estimated Value
Home Financials for this Owner
Home Financials are based on the most recent Mortgage that was taken out on this home.
Original Mortgage
$186,202
Outstanding Balance
$183,747
Interest Rate
6.47%
Mortgage Type
FHA
Estimated Equity
$142,109
Purchase Details
Closed on
Mar 9, 2011
Sold by
U S Bank National Association
Bought by
Michel Catherine L
Home Financials for this Owner
Home Financials are based on the most recent Mortgage that was taken out on this home.
Original Mortgage
$95,026
Interest Rate
4.84%
Mortgage Type
FHA
Purchase Details
Closed on
Jan 28, 2011
Sold by
Anderson Jeffrey O and Anderson Shelli Inga
Bought by
U S Bank National Association
Home Financials for this Owner
Home Financials are based on the most recent Mortgage that was taken out on this home.
Original Mortgage
$95,026
Interest Rate
4.84%
Mortgage Type
FHA
Create a Home Valuation Report for This Property
The Home Valuation Report is an in-depth analysis detailing your home's value as well as a comparison with similar homes in the area
Home Values in the Area
Average Home Value in this Area
Purchase History
| Date | Buyer | Sale Price | Title Company |
|---|---|---|---|
| Jones Catherine | -- | Amerititle | |
| Michel Catherine L | $97,500 | Fidelity Natl Title Co Of Or | |
| U S Bank National Association | $111,671 | None Available |
Source: Public Records
Mortgage History
| Date | Status | Borrower | Loan Amount |
|---|---|---|---|
| Open | Jones Catherine | $186,202 | |
| Previous Owner | Michel Catherine L | $95,026 |
Source: Public Records
Tax History Compared to Growth
Tax History
| Year | Tax Paid | Tax Assessment Tax Assessment Total Assessment is a certain percentage of the fair market value that is determined by local assessors to be the total taxable value of land and additions on the property. | Land | Improvement |
|---|---|---|---|---|
| 2025 | $2,239 | $117,260 | -- | -- |
| 2024 | $2,050 | $113,850 | -- | -- |
| 2023 | $1,960 | $113,850 | $0 | $0 |
| 2022 | $1,884 | $107,330 | $0 | $0 |
| 2021 | $1,906 | $104,210 | $0 | $0 |
| 2020 | $1,856 | $101,180 | $0 | $0 |
| 2019 | $1,797 | $98,240 | $0 | $0 |
| 2018 | $1,735 | $95,380 | $0 | $0 |
| 2017 | $1,677 | $92,610 | $0 | $0 |
| 2016 | $1,622 | $89,920 | $0 | $0 |
| 2015 | $1,569 | $87,310 | $0 | $0 |
| 2014 | $1,269 | $84,770 | $0 | $0 |
| 2013 | -- | $82,310 | $0 | $0 |
Source: Public Records
Map
Nearby Homes
- 1426 Kane St
- 5045 Shasta Way
- 1726 Kane St
- 1721 Homedale Rd
- 4847 Shasta Way
- 5511 Edith Way
- 1826 Homedale Rd
- 1647 Hope St
- 5122 Bryant Ave
- 1558 Hope St
- 1904 Logan St
- 1604 Hope St
- 1017 Homedale Rd
- 5449 Shalynn Dr
- 5817 Alva Ave
- 862 Kane St
- 1740 Gary St
- 4429 Shasta Way
- 4741 S 6th St Unit 26
- 6010 Shasta Way