1609 Live Oak Park Unit 1609 Johns Island, SC 29455
Estimated Value: $295,000 - $395,218
1
Bed
1
Bath
850
Sq Ft
$413/Sq Ft
Est. Value
About This Home
This home is located at 1609 Live Oak Park Unit 1609, Johns Island, SC 29455 and is currently estimated at $351,055, approximately $413 per square foot. 1609 Live Oak Park Unit 1609 is a home located in Charleston County with nearby schools including Mt. Zion Elementary School, Haut Gap Middle School, and St. Johns High School.
Ownership History
Date
Name
Owned For
Owner Type
Purchase Details
Closed on
Nov 10, 2016
Sold by
Blindauer Daniel M and Blindauer Sheila J
Bought by
Workamn Brian P
Current Estimated Value
Home Financials for this Owner
Home Financials are based on the most recent Mortgage that was taken out on this home.
Original Mortgage
$90,000
Outstanding Balance
$72,481
Interest Rate
3.52%
Mortgage Type
New Conventional
Estimated Equity
$278,574
Purchase Details
Closed on
Oct 13, 2005
Sold by
Shealy Robert B and Shealy Lorraine
Bought by
Blindauer Daniel M and Blindauer Sheila J
Purchase Details
Closed on
Dec 16, 2004
Sold by
Moxley Richard T and Moxley Jennifer K
Bought by
Shealy Robert B and Shealy Lorraine
Purchase Details
Closed on
Mar 28, 2002
Sold by
Schweikart Robert A
Bought by
Moxley Richard T and Moxley Jennifer K
Purchase Details
Closed on
Apr 24, 2000
Sold by
Schweikart Suzanne E
Bought by
Schweikart Robert A
Create a Home Valuation Report for This Property
The Home Valuation Report is an in-depth analysis detailing your home's value as well as a comparison with similar homes in the area
Home Values in the Area
Average Home Value in this Area
Purchase History
| Date | Buyer | Sale Price | Title Company |
|---|---|---|---|
| Workamn Brian P | $115,000 | -- | |
| Blindauer Daniel M | $167,500 | -- | |
| Shealy Robert B | $119,000 | -- | |
| Moxley Richard T | $107,000 | -- | |
| Schweikart Robert A | -- | -- |
Source: Public Records
Mortgage History
| Date | Status | Borrower | Loan Amount |
|---|---|---|---|
| Open | Workamn Brian P | $90,000 |
Source: Public Records
Tax History Compared to Growth
Tax History
| Year | Tax Paid | Tax Assessment Tax Assessment Total Assessment is a certain percentage of the fair market value that is determined by local assessors to be the total taxable value of land and additions on the property. | Land | Improvement |
|---|---|---|---|---|
| 2024 | $618 | $5,290 | $0 | $0 |
| 2023 | $618 | $5,290 | $0 | $0 |
| 2022 | $553 | $5,290 | $0 | $0 |
| 2021 | $1,861 | $5,290 | $0 | $0 |
| 2020 | $1,836 | $7,930 | $0 | $0 |
| 2019 | $1,686 | $6,900 | $0 | $0 |
| 2017 | $1,599 | $6,900 | $0 | $0 |
| 2016 | $1,526 | $6,830 | $0 | $0 |
| 2015 | $1,450 | $6,830 | $0 | $0 |
| 2014 | $1,852 | $0 | $0 | $0 |
| 2011 | -- | $0 | $0 | $0 |
Source: Public Records
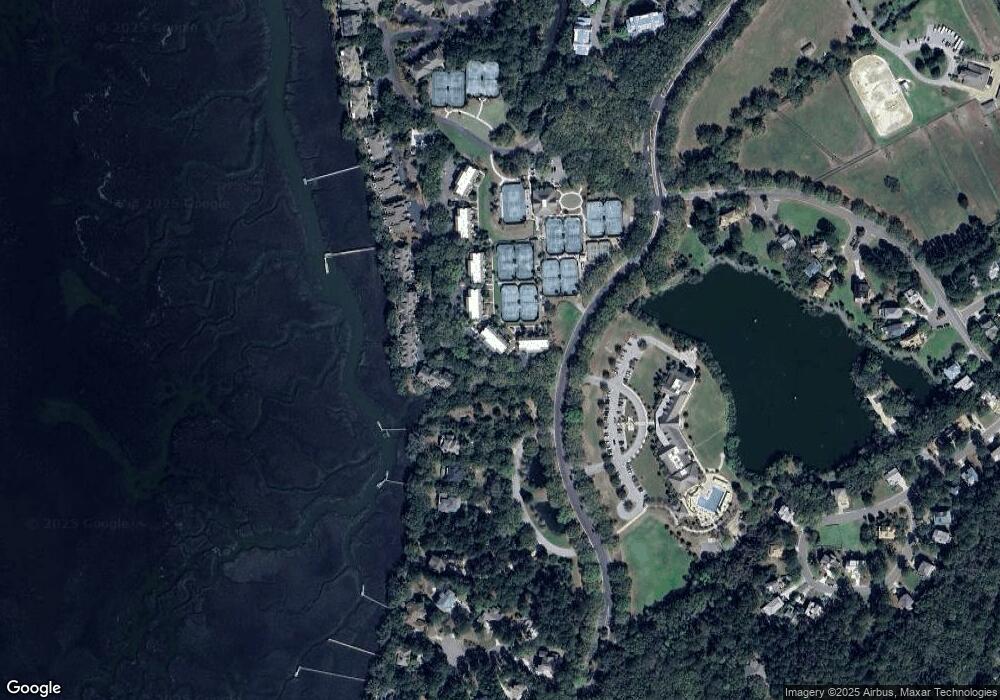
Map
Nearby Homes
- 1617 Live Oak Park Unit 1617
- 1614 Live Oak Park Unit 1614
- 1625 Live Oak Park
- 1605 Live Oak Park Unit 1605
- 1627 Live Oak Park
- 1720 Live Oak Park
- 1721 Live Oak Park
- 1723 Live Oak Park
- 1634 Live Oak Park
- 1638 Live Oak Park Unit 1638
- 1637 Live Oak Park
- 2195 Seabrook Island Rd
- 2063 Long Bend Dr
- 2017 Long Bend Dr Unit 2017
- 2014 Long Bend Dr
- 2020 Long Bend Dr
- 2472 Racquet Club Dr
- 2465 Racquet Club Dr
- 2375 Seabrook Island Rd
- 4021 Bridle Trail Dr
- 1610 Live Oak Park
- 1611 Live Oak Park Unit 1611
- 1614 Courtside Villas
- 1609 Courtside Villa
- 1615 Courtside Villas
- 1615 Live Oak Park Unit 1615
- 1607 Courtside Villas
- 1608 Courtside Villas
- 1606 Live Oak Park
- 1606 Courtside Villas
- 1607 Live Oak Park Unit 1607
- 1604 Live Oak Park Unit 1604
- 1604 Courtside Villas
- 1612 Live Oak Park Unit ID1248637P
- 1630 Live Oak Park Unit 1630
- 1622 Live Oak Park
- 1612 Live Oak Park
- 1608 Live Oak Park Unit 1608
- 1613 Courtside Villa
- 1621 Courtside Villas