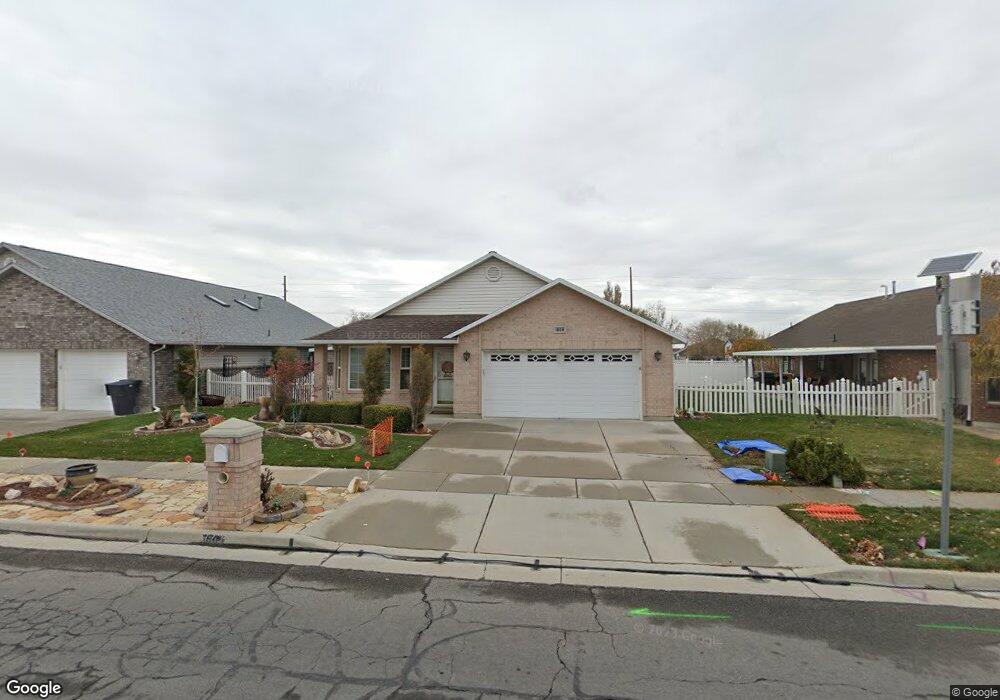
1609 N 950 W Clearfield, UT 84015
Estimated Value: $457,320 - $507,000
3
Beds
2
Baths
1,833
Sq Ft
$263/Sq Ft
Est. Value
About This Home
This home is located at 1609 N 950 W, Clearfield, UT 84015 and is currently estimated at $482,830, approximately $263 per square foot. 1609 N 950 W is a home located in Davis County with nearby schools including Clinton Elementary School, Sunset Junior High School, and Clearfield High School.
Ownership History
Date
Name
Owned For
Owner Type
Purchase Details
Closed on
Jun 9, 2023
Sold by
Woolley Kimball F
Bought by
Woolley Family Trust
Current Estimated Value
Purchase Details
Closed on
Feb 19, 2015
Sold by
Fronberg Charles C and Fronberg Loretta B
Bought by
Woolley Kimball F
Purchase Details
Closed on
Jun 18, 2013
Sold by
Clark Michael A
Bought by
Fronberg Charles C and Fronberg Loretta B
Purchase Details
Closed on
Feb 28, 2006
Sold by
Hadlock Dennis G and Hadlock Katherine B
Bought by
Hadlock Katherine B and Hadlock Dennis G
Purchase Details
Closed on
Dec 12, 2003
Sold by
Windruff Construction Co
Bought by
Hadlock Dennis G and Hadlock Katherine B
Home Financials for this Owner
Home Financials are based on the most recent Mortgage that was taken out on this home.
Original Mortgage
$30,000
Interest Rate
4.62%
Mortgage Type
Purchase Money Mortgage
Create a Home Valuation Report for This Property
The Home Valuation Report is an in-depth analysis detailing your home's value as well as a comparison with similar homes in the area
Home Values in the Area
Average Home Value in this Area
Purchase History
| Date | Buyer | Sale Price | Title Company |
|---|---|---|---|
| Woolley Family Trust | -- | None Listed On Document | |
| Woolley Kimball F | -- | First American Title | |
| Fronberg Charles C | -- | Founders Title Co L | |
| Hadlock Katherine B | -- | None Available | |
| Hadlock Dennis G | -- | Bonneville Title Company Inc |
Source: Public Records
Mortgage History
| Date | Status | Borrower | Loan Amount |
|---|---|---|---|
| Previous Owner | Hadlock Dennis G | $30,000 |
Source: Public Records
Tax History Compared to Growth
Tax History
| Year | Tax Paid | Tax Assessment Tax Assessment Total Assessment is a certain percentage of the fair market value that is determined by local assessors to be the total taxable value of land and additions on the property. | Land | Improvement |
|---|---|---|---|---|
| 2025 | $2,568 | $246,950 | $74,883 | $172,067 |
| 2024 | $2,492 | $240,900 | $83,773 | $157,127 |
| 2023 | $2,264 | $405,000 | $92,764 | $312,236 |
| 2022 | $2,557 | $253,000 | $59,907 | $193,093 |
| 2021 | $2,378 | $349,000 | $69,697 | $279,303 |
| 2020 | $2,065 | $300,000 | $56,578 | $243,422 |
| 2019 | $2,015 | $286,000 | $71,086 | $214,914 |
| 2018 | $1,879 | $262,000 | $60,717 | $201,283 |
| 2016 | $1,603 | $115,390 | $23,063 | $92,327 |
| 2015 | $1,547 | $105,875 | $23,063 | $82,812 |
| 2014 | $1,487 | $103,362 | $23,063 | $80,299 |
| 2013 | -- | $108,784 | $28,590 | $80,194 |
Source: Public Records
Map
Nearby Homes