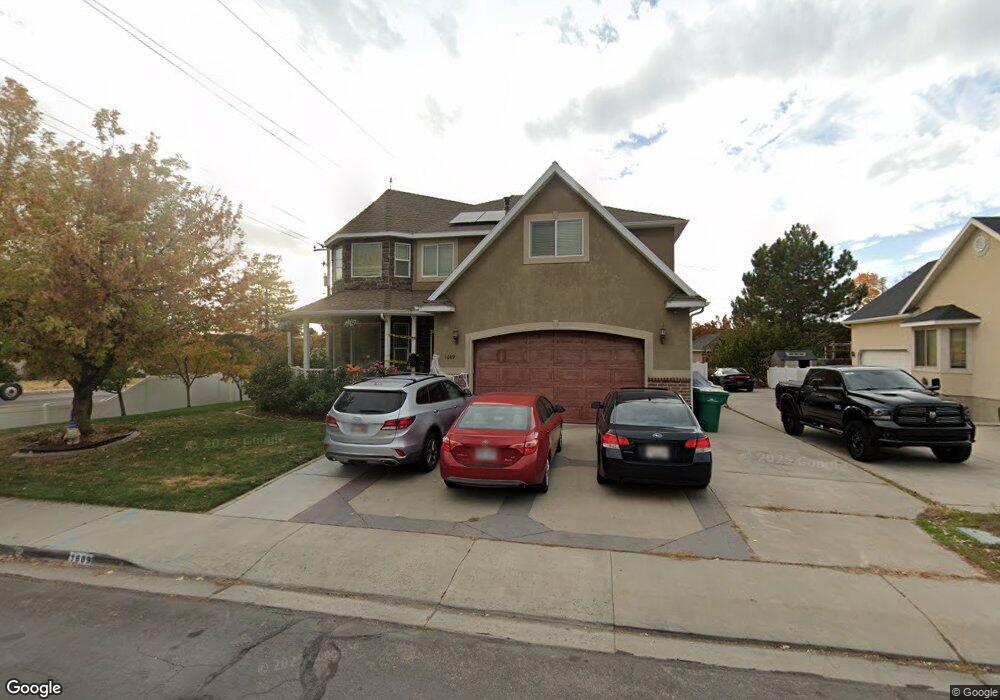
1609 N 980 W Orem, UT 84057
Aspen NeighborhoodEstimated Value: $764,000 - $817,000
6
Beds
4
Baths
4,375
Sq Ft
$180/Sq Ft
Est. Value
About This Home
This home is located at 1609 N 980 W, Orem, UT 84057 and is currently estimated at $786,174, approximately $179 per square foot. 1609 N 980 W is a home located in Utah County with nearby schools including Aspen Elementary School, Oak Canyon Junior High School, and Timpanogos High School.
Ownership History
Date
Name
Owned For
Owner Type
Purchase Details
Closed on
Jun 24, 2015
Sold by
Gardiner Frank
Bought by
Brown Scott Jeffrey and Brown Kathleen Joy
Current Estimated Value
Home Financials for this Owner
Home Financials are based on the most recent Mortgage that was taken out on this home.
Original Mortgage
$298,381
Outstanding Balance
$232,090
Interest Rate
3.87%
Mortgage Type
FHA
Estimated Equity
$554,085
Purchase Details
Closed on
May 5, 2009
Sold by
Hand Claudio
Bought by
Gardiner Frank
Purchase Details
Closed on
Apr 18, 2007
Sold by
Nielson Christopher and Nielson Lisa K
Bought by
Nielson Christopher and Nielson Lisa K
Home Financials for this Owner
Home Financials are based on the most recent Mortgage that was taken out on this home.
Original Mortgage
$120,000
Interest Rate
6.41%
Mortgage Type
New Conventional
Purchase Details
Closed on
Oct 21, 2005
Sold by
Hatfield Morgan and Hatfield Melanie
Bought by
Gardiner Frank and Hand Claudio
Home Financials for this Owner
Home Financials are based on the most recent Mortgage that was taken out on this home.
Original Mortgage
$71,000
Interest Rate
5.74%
Mortgage Type
Stand Alone Second
Purchase Details
Closed on
Feb 25, 2005
Sold by
Hatfield Morgan E and Hatfield Melanie
Bought by
Hatfield Morgan and Hatfield Melanie
Home Financials for this Owner
Home Financials are based on the most recent Mortgage that was taken out on this home.
Original Mortgage
$276,000
Interest Rate
6.5%
Mortgage Type
Adjustable Rate Mortgage/ARM
Purchase Details
Closed on
Feb 23, 2005
Sold by
Hatfield Ronald A
Bought by
Hatfield Morgan E and Hatfield Melanie
Home Financials for this Owner
Home Financials are based on the most recent Mortgage that was taken out on this home.
Original Mortgage
$276,000
Interest Rate
6.5%
Mortgage Type
Adjustable Rate Mortgage/ARM
Purchase Details
Closed on
Nov 26, 2004
Sold by
Hatfield Ronald A
Bought by
Hatfield Ronald A and Hatfield Morgan E
Purchase Details
Closed on
Dec 10, 2002
Sold by
Utah West Development Inc
Bought by
Hatfield Ronald A
Create a Home Valuation Report for This Property
The Home Valuation Report is an in-depth analysis detailing your home's value as well as a comparison with similar homes in the area
Home Values in the Area
Average Home Value in this Area
Purchase History
| Date | Buyer | Sale Price | Title Company |
|---|---|---|---|
| Brown Scott Jeffrey | -- | Inwest Title Services | |
| Gardiner Frank | -- | Integrated Tilte Insurance | |
| Nielson Christopher | -- | Surety Title | |
| Gardiner Frank | -- | Fidelity Land & Title | |
| Hatfield Morgan | -- | Fidelity Land & Title | |
| Hatfield Ronald A | -- | Fidelity Land & Title | |
| Hatfield Morgan E | -- | Fidelity Land & Title | |
| Hatfield Ronald A | -- | Fidelity Land & Title | |
| Hatfield Ronald A | -- | Metro National Title |
Source: Public Records
Mortgage History
| Date | Status | Borrower | Loan Amount |
|---|---|---|---|
| Open | Brown Scott Jeffrey | $298,381 | |
| Previous Owner | Nielson Christopher | $120,000 | |
| Previous Owner | Gardiner Frank | $71,000 | |
| Previous Owner | Hatfield Morgan | $276,000 | |
| Previous Owner | Hatfield Morgan E | $276,000 |
Source: Public Records
Tax History
| Year | Tax Paid | Tax Assessment Tax Assessment Total Assessment is a certain percentage of the fair market value that is determined by local assessors to be the total taxable value of land and additions on the property. | Land | Improvement |
|---|---|---|---|---|
| 2025 | $3,261 | $407,440 | -- | -- |
| 2024 | $3,261 | $398,805 | $0 | $0 |
| 2023 | $3,055 | $401,445 | $0 | $0 |
| 2022 | $3,318 | $422,510 | $0 | $0 |
| 2021 | $3,025 | $583,300 | $179,400 | $403,900 |
| 2020 | $2,853 | $540,700 | $156,000 | $384,700 |
| 2019 | $2,725 | $537,100 | $156,000 | $381,100 |
| 2018 | $2,588 | $487,400 | $156,000 | $331,400 |
| 2017 | $2,436 | $245,740 | $0 | $0 |
| 2016 | $2,539 | $236,170 | $0 | $0 |
| 2015 | $2,531 | $222,640 | $0 | $0 |
| 2014 | $2,499 | $218,845 | $0 | $0 |
Source: Public Records
Map
Nearby Homes
Your Personal Tour Guide
Ask me questions while you tour the home.