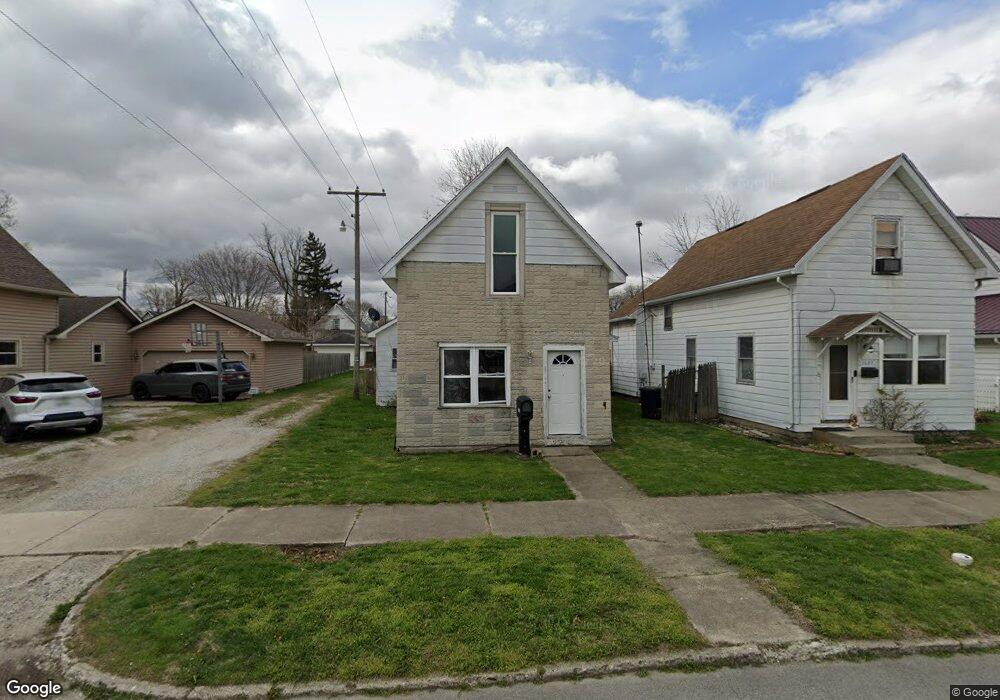
1609 N D St Elwood, IN 46036
Estimated Value: $114,222 - $160,000
3
Beds
1
Bath
1,371
Sq Ft
$99/Sq Ft
Est. Value
About This Home
This home is located at 1609 N D St, Elwood, IN 46036 and is currently estimated at $136,306, approximately $99 per square foot. 1609 N D St is a home located in Madison County with nearby schools including Elwood Elementary School, Elwood Intermediate School, and Elwood Junior-Senior High School.
Ownership History
Date
Name
Owned For
Owner Type
Purchase Details
Closed on
Mar 21, 2025
Sold by
Idaf Llc
Bought by
Lazarus Development Llc
Current Estimated Value
Purchase Details
Closed on
Aug 9, 2024
Sold by
Sang Investments Llc
Bought by
Idaf Llc
Home Financials for this Owner
Home Financials are based on the most recent Mortgage that was taken out on this home.
Original Mortgage
$80,000
Interest Rate
6.95%
Mortgage Type
Credit Line Revolving
Purchase Details
Closed on
Feb 13, 2024
Sold by
Beeman Lewis N
Bought by
Caldwell Phillp and Caldwell Sossidy
Create a Home Valuation Report for This Property
The Home Valuation Report is an in-depth analysis detailing your home's value as well as a comparison with similar homes in the area
Home Values in the Area
Average Home Value in this Area
Purchase History
| Date | Buyer | Sale Price | Title Company |
|---|---|---|---|
| Lazarus Development Llc | -- | None Listed On Document | |
| Idaf Llc | -- | Hoosier Title & Abstract Llc | |
| Sang Investments Llc | -- | Hoosier Title & Abstract Llc | |
| Caldwell Phillp | -- | None Listed On Document |
Source: Public Records
Mortgage History
| Date | Status | Borrower | Loan Amount |
|---|---|---|---|
| Previous Owner | Idaf Llc | $80,000 |
Source: Public Records
Tax History Compared to Growth
Tax History
| Year | Tax Paid | Tax Assessment Tax Assessment Total Assessment is a certain percentage of the fair market value that is determined by local assessors to be the total taxable value of land and additions on the property. | Land | Improvement |
|---|---|---|---|---|
| 2025 | $764 | $38,200 | $6,900 | $31,300 |
| 2024 | $764 | $38,200 | $6,900 | $31,300 |
| 2023 | $724 | $35,100 | $6,600 | $28,500 |
| 2022 | $727 | $34,700 | $6,100 | $28,600 |
| 2021 | $599 | $29,800 | $6,000 | $23,800 |
| 2020 | $563 | $27,500 | $5,500 | $22,000 |
| 2019 | $859 | $26,800 | $5,500 | $21,300 |
| 2018 | $525 | $25,600 | $5,500 | $20,100 |
| 2017 | $511 | $25,400 | $5,500 | $19,900 |
| 2016 | $542 | $26,500 | $5,400 | $21,100 |
| 2014 | $544 | $27,100 | $5,500 | $21,600 |
| 2013 | $544 | $27,100 | $5,500 | $21,600 |
Source: Public Records
Map
Nearby Homes