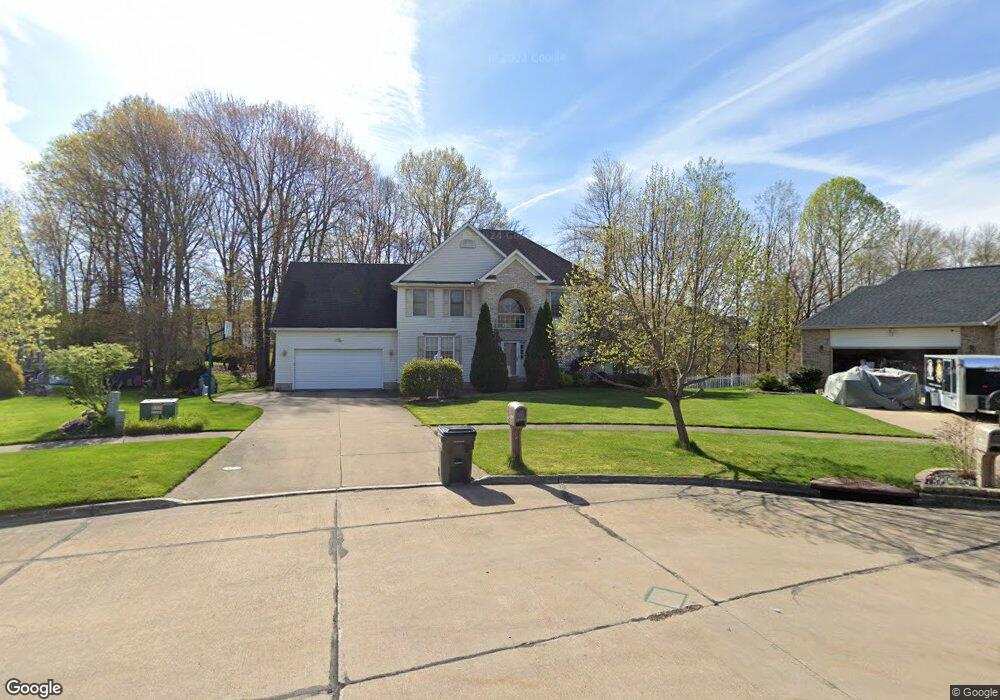
1609 Timbertop Dr Tallmadge, OH 44278
Estimated Value: $370,000 - $440,000
3
Beds
4
Baths
2,820
Sq Ft
$149/Sq Ft
Est. Value
About This Home
This home is located at 1609 Timbertop Dr, Tallmadge, OH 44278 and is currently estimated at $419,967, approximately $148 per square foot. 1609 Timbertop Dr is a home located in Portage County with nearby schools including Tallmadge Middle School and Tallmadge High School.
Ownership History
Date
Name
Owned For
Owner Type
Purchase Details
Closed on
Nov 1, 2007
Sold by
Alexander Edward J and Alexander Cindi L
Bought by
Cirullo Ronald C and Cirullo Lyn M
Current Estimated Value
Home Financials for this Owner
Home Financials are based on the most recent Mortgage that was taken out on this home.
Original Mortgage
$189,100
Outstanding Balance
$119,645
Interest Rate
6.38%
Mortgage Type
Purchase Money Mortgage
Estimated Equity
$300,322
Purchase Details
Closed on
Sep 2, 1997
Sold by
Sponseller Builders Inc
Bought by
Alexander Edward J and Virgil Cindi L
Purchase Details
Closed on
Jan 10, 1997
Sold by
W G Lockhart Realty Co
Bought by
Sponseller Et Al Sponseller Builders Inc
Home Financials for this Owner
Home Financials are based on the most recent Mortgage that was taken out on this home.
Original Mortgage
$42,750
Interest Rate
7.58%
Mortgage Type
New Conventional
Create a Home Valuation Report for This Property
The Home Valuation Report is an in-depth analysis detailing your home's value as well as a comparison with similar homes in the area
Home Values in the Area
Average Home Value in this Area
Purchase History
| Date | Buyer | Sale Price | Title Company |
|---|---|---|---|
| Cirullo Ronald C | $270,000 | Chicago Title Insurance Comp | |
| Alexander Edward J | $45,000 | -- | |
| Sponseller Et Al Sponseller Builders Inc | $42,750 | -- |
Source: Public Records
Mortgage History
| Date | Status | Borrower | Loan Amount |
|---|---|---|---|
| Open | Cirullo Ronald C | $189,100 | |
| Previous Owner | Sponseller Et Al Sponseller Builders Inc | $42,750 | |
| Closed | Alexander Edward J | -- |
Source: Public Records
Tax History Compared to Growth
Tax History
| Year | Tax Paid | Tax Assessment Tax Assessment Total Assessment is a certain percentage of the fair market value that is determined by local assessors to be the total taxable value of land and additions on the property. | Land | Improvement |
|---|---|---|---|---|
| 2024 | $6,181 | $133,070 | $15,750 | $117,320 |
| 2023 | $4,784 | $100,940 | $15,750 | $85,190 |
| 2022 | $5,659 | $100,940 | $15,750 | $85,190 |
| 2021 | $5,685 | $100,940 | $15,750 | $85,190 |
| 2020 | $5,003 | $87,330 | $15,750 | $71,580 |
| 2019 | $5,544 | $87,330 | $15,750 | $71,580 |
| 2018 | $4,414 | $77,950 | $15,750 | $62,200 |
| 2017 | $4,414 | $77,950 | $15,750 | $62,200 |
| 2016 | $4,724 | $77,950 | $15,750 | $62,200 |
| 2015 | $4,353 | $77,950 | $15,750 | $62,200 |
| 2014 | $4,329 | $77,950 | $15,750 | $62,200 |
| 2013 | $4,207 | $77,950 | $15,750 | $62,200 |
Source: Public Records
Map
Nearby Homes
- 1239 Glenoak Dr
- 490 Vandalia Dr
- 330 Hanna Dr
- 124 Tallmadge Rd
- 112 Tallmadge Rd
- V/L Tallmadge Rd
- 1075 Amy Trail
- Aspire Plan at Tallmadge Reserve
- Fairview Plan at Tallmadge Reserve
- Crisfield Plan at Tallmadge Reserve
- Mitchell Plan at Tallmadge Reserve
- Passport Plan at Tallmadge Reserve
- Hampton Plan at Tallmadge Reserve
- Oakdale Plan at Tallmadge Reserve
- 1168 East Ave
- 988 Beechwood Dr
- 187 Oakview Cir
- 3167 Mogadore Rd
- 915 Treat Blvd
- 43 Benjamin Way
- 1597 Timbertop Dr
- 1615 Timbertop Dr
- 1583 Timbertop Dr
- 1481 Timbertop Dr
- 1621 Timbertop Dr
- 1489 Timbertop Dr
- 1473 Timbertop Dr
- 1573 Timbertop Dr
- 1499 Timbertop Dr
- 1465 Timbertop Dr
- 1507 Timbertop Dr
- 1602 Timbertop Dr
- 1596 Timbertop Dr
- 1590 Timbertop Dr
- 1415 Glenoak Dr
- 1407 Glenoak Dr
- 1425 Glenoak Dr
- 1582 Timbertop Dr
- 1399 Glenoak Dr
- 1457 Timbertop Dr