
Seller's Agent in 2025
Andrea Peters
Windermere Corporate
(360) 915-2582
2 in this area
44 Total Sales
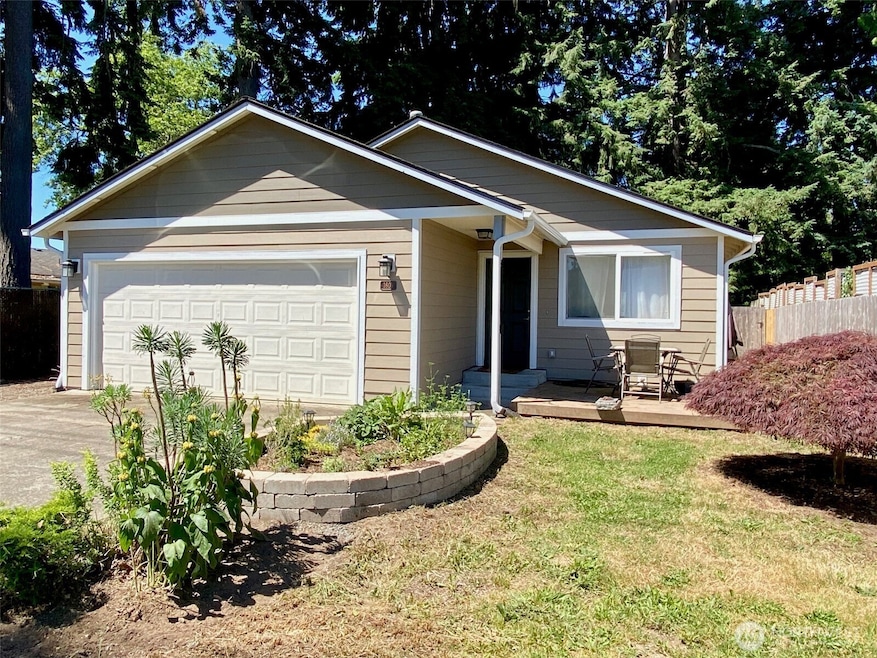


Desirable one level living in the heart of Olympia! Welcome to this beautifully maintained 3-bedroom, 2-bathroom rambler nestled in Olympia’s sought-after Eastside community. This thoughtfully designed single-level home offers comfort, convenience, and timeless appeal. Step inside to discover an inviting open-concept living area with abundant natural light, a spacious kitchen with dining area and three generous bedrooms. Fully fenced backyard is great for enjoying BBQ's and for the pup! Close to everything including bus lines, downtown shops, restaurants, entertainment and convenient to I-5 and JBLM.4 yr old roof, siding, and new furnace. Olympia School District. This is a must see!
Last Agent to Sell the Property
Windermere Real Estate Olympia License #115200 Listed on: 07/17/2025
Source: Northwest Multiple Listing Service (NWMLS)
MLS#: 2408590
| Date | Type | Sale Price | Title Company |
|---|---|---|---|
| Warranty Deed | $465,000 | Chicago Title | |
| Warranty Deed | $242,900 | Chicago Title Company | |
| Warranty Deed | $145,120 | Chicago Title Co | |
| Warranty Deed | $132,500 | Chicago Title Insurance Comp |
| Date | Status | Loan Amount | Loan Type |
|---|---|---|---|
| Previous Owner | $50,000 | Credit Line Revolving | |
| Previous Owner | $203,250 | New Conventional | |
| Previous Owner | $218,610 | Unknown | |
| Previous Owner | $25,600 | Credit Line Revolving | |
| Previous Owner | $136,000 | Unknown | |
| Previous Owner | $142,950 | FHA | |
| Previous Owner | $130,630 | FHA |
| Date | Event | Price | Change | Sq Ft Price |
|---|---|---|---|---|
| 09/09/2025 09/09/25 | Sold | $465,000 | -3.5% | $357 / Sq Ft |
| 08/26/2025 08/26/25 | Pending | -- | -- | -- |
| 08/14/2025 08/14/25 | Price Changed | $482,000 | -2.0% | $370 / Sq Ft |
| 07/30/2025 07/30/25 | For Sale | $492,000 | 0.0% | $378 / Sq Ft |
| 07/19/2025 07/19/25 | Pending | -- | -- | -- |
| 07/17/2025 07/17/25 | For Sale | $492,000 | -- | $378 / Sq Ft |
| Year | Tax Paid | Tax Assessment Tax Assessment Total Assessment is a certain percentage of the fair market value that is determined by local assessors to be the total taxable value of land and additions on the property. | Land | Improvement |
|---|---|---|---|---|
| 2024 | $4,278 | $429,300 | $175,200 | $254,100 |
| 2023 | $4,278 | $408,800 | $140,600 | $268,200 |
| 2022 | $3,970 | $384,100 | $112,600 | $271,500 |
| 2021 | $3,436 | $332,100 | $98,500 | $233,600 |
| 2020 | $3,341 | $265,900 | $69,000 | $196,900 |
| 2019 | $3,046 | $252,200 | $67,100 | $185,100 |
| 2018 | $2,935 | $217,800 | $59,100 | $158,700 |
| 2017 | $2,673 | $213,650 | $70,050 | $143,600 |
| 2016 | $2,429 | $202,850 | $57,250 | $145,600 |
| 2014 | -- | $194,050 | $59,650 | $134,400 |
Seller's Agent in 2025
Andrea Peters
Windermere Corporate
(360) 915-2582
2 in this area
44 Total Sales
Buyer's Agent in 2025
Missy Watts
Olympic Sotheby's Int'l Realty
(360) 280-0509
12 in this area
186 Total Sales
Source: Northwest Multiple Listing Service (NWMLS)
MLS Number: 2408590
APN: 61400800900
Disclaimer: Certain information contained herein is derived from information provided by parties other than Homes.com. All information provided is deemed reliable, but is not guaranteed to be accurate and should be independently verified.
![]() All data is obtained from various sources and may not have been verified by broker or MLS GRID. Supplied Open House Information is subject to change without notice. All information should be independently reviewed and verified for accuracy. Properties may or may not be listed by the office/agent presenting the information. Listing information is provided by the Northwest Multiple Listing Service (NWMLS). Property information is based on available data that may include MLS information, county records, and other sources. Listings marked with the 3 tree icon and provided by NWMLS. All properties are subject to prior sale or withdrawal. IDX information is provided exclusively for consumers’ personal noncommercial use, that it may not be used for any purpose other than to identify prospective properties consumers may be interested in purchasing, that the data is deemed reliable but is not guaranteed by MLS GRID. ©2025 NWMLS.
All data is obtained from various sources and may not have been verified by broker or MLS GRID. Supplied Open House Information is subject to change without notice. All information should be independently reviewed and verified for accuracy. Properties may or may not be listed by the office/agent presenting the information. Listing information is provided by the Northwest Multiple Listing Service (NWMLS). Property information is based on available data that may include MLS information, county records, and other sources. Listings marked with the 3 tree icon and provided by NWMLS. All properties are subject to prior sale or withdrawal. IDX information is provided exclusively for consumers’ personal noncommercial use, that it may not be used for any purpose other than to identify prospective properties consumers may be interested in purchasing, that the data is deemed reliable but is not guaranteed by MLS GRID. ©2025 NWMLS.
Based on information submitted to the MLS GRID