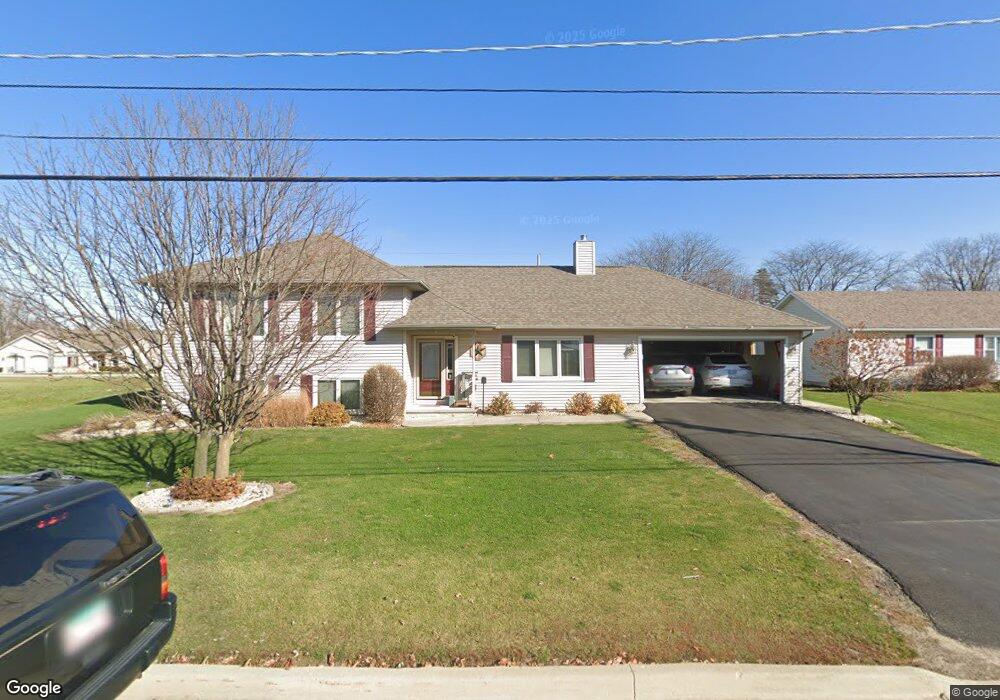
1609 W Main St Mendota, IL 61342
Estimated Value: $230,693 - $266,000
4
Beds
2
Baths
2,339
Sq Ft
$106/Sq Ft
Est. Value
About This Home
This home is located at 1609 W Main St, Mendota, IL 61342 and is currently estimated at $248,173, approximately $106 per square foot. 1609 W Main St is a home located in LaSalle County with nearby schools including Northbrook School, Lincoln Elementary School, and Blackstone Elementary School.
Ownership History
Date
Name
Owned For
Owner Type
Purchase Details
Closed on
Aug 14, 2017
Sold by
Faber Marcy
Bought by
Faber Brian
Current Estimated Value
Purchase Details
Closed on
Sep 23, 2005
Sold by
Nolte Cory O
Bought by
Faber Brian C and Faber Marcy M
Home Financials for this Owner
Home Financials are based on the most recent Mortgage that was taken out on this home.
Original Mortgage
$120,800
Outstanding Balance
$36,717
Interest Rate
4.75%
Mortgage Type
Adjustable Rate Mortgage/ARM
Estimated Equity
$211,456
Create a Home Valuation Report for This Property
The Home Valuation Report is an in-depth analysis detailing your home's value as well as a comparison with similar homes in the area
Home Values in the Area
Average Home Value in this Area
Purchase History
| Date | Buyer | Sale Price | Title Company |
|---|---|---|---|
| Faber Brian | -- | -- | |
| Faber Brian C | $151,000 | None Available |
Source: Public Records
Mortgage History
| Date | Status | Borrower | Loan Amount |
|---|---|---|---|
| Open | Faber Brian C | $120,800 |
Source: Public Records
Tax History
| Year | Tax Paid | Tax Assessment Tax Assessment Total Assessment is a certain percentage of the fair market value that is determined by local assessors to be the total taxable value of land and additions on the property. | Land | Improvement |
|---|---|---|---|---|
| 2024 | $4,413 | $56,948 | $8,545 | $48,403 |
| 2023 | $4,192 | $53,034 | $7,958 | $45,076 |
| 2022 | $3,830 | $48,349 | $7,255 | $41,094 |
| 2021 | $3,782 | $45,768 | $6,868 | $38,900 |
| 2020 | $3,527 | $43,214 | $6,485 | $36,729 |
| 2019 | $3,577 | $43,214 | $6,485 | $36,729 |
| 2018 | $3,576 | $42,267 | $6,343 | $35,924 |
| 2017 | $3,615 | $41,733 | $6,263 | $35,470 |
| 2016 | $3,341 | $39,955 | $5,996 | $33,959 |
| 2015 | $3,237 | $38,742 | $5,814 | $32,928 |
| 2012 | -- | $43,011 | $6,659 | $36,352 |
Source: Public Records
Map
Nearby Homes
Your Personal Tour Guide
Ask me questions while you tour the home.