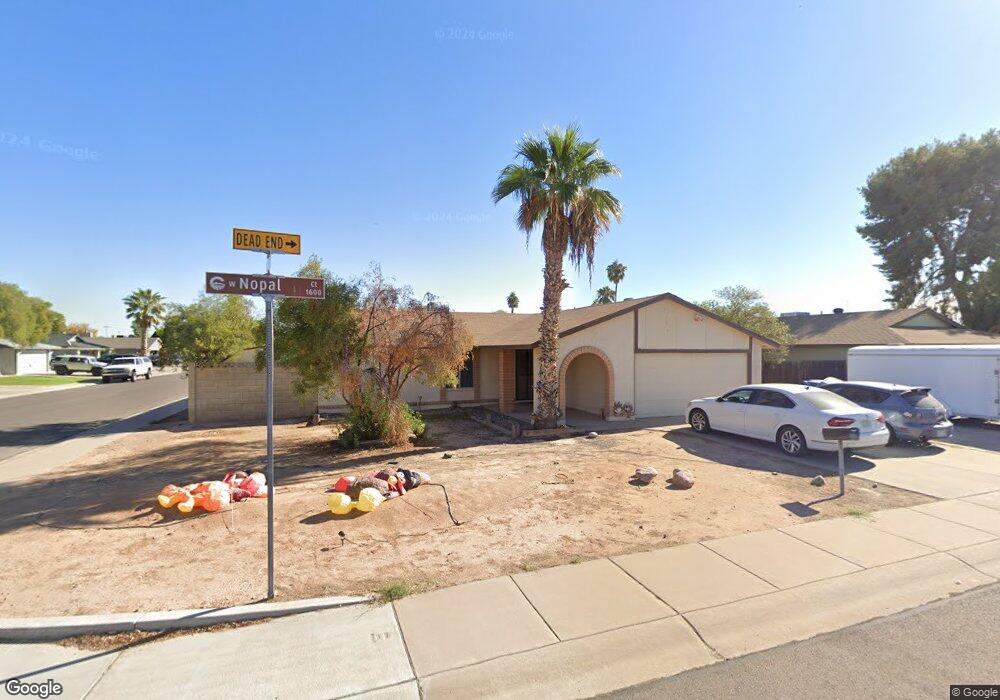
1609 W Nopal Ct Chandler, AZ 85224
Amberwood NeighborhoodEstimated Value: $368,397 - $443,000
3
Beds
2
Baths
1,249
Sq Ft
$317/Sq Ft
Est. Value
About This Home
This home is located at 1609 W Nopal Ct, Chandler, AZ 85224 and is currently estimated at $396,099, approximately $317 per square foot. 1609 W Nopal Ct is a home located in Maricopa County with nearby schools including Pomeroy Elementary School, Franklin at Brimhall Elementary School, and Summit Academy Elementary.
Ownership History
Date
Name
Owned For
Owner Type
Purchase Details
Closed on
Feb 27, 2007
Sold by
Gasca Peter P
Bought by
Gasca Peter P and Gasca David J
Current Estimated Value
Purchase Details
Closed on
Jul 21, 2004
Sold by
Turner Jerry T and Turner Karen L
Bought by
Gasca Peter P and Gasca Luann C
Home Financials for this Owner
Home Financials are based on the most recent Mortgage that was taken out on this home.
Original Mortgage
$111,200
Outstanding Balance
$50,584
Interest Rate
4.87%
Mortgage Type
Purchase Money Mortgage
Estimated Equity
$345,515
Purchase Details
Closed on
Jun 17, 1996
Sold by
Marchant Bret A and Marchant Jan
Bought by
Turner Jerry T and Turner Karen L
Home Financials for this Owner
Home Financials are based on the most recent Mortgage that was taken out on this home.
Original Mortgage
$89,760
Interest Rate
8.39%
Mortgage Type
VA
Create a Home Valuation Report for This Property
The Home Valuation Report is an in-depth analysis detailing your home's value as well as a comparison with similar homes in the area
Home Values in the Area
Average Home Value in this Area
Purchase History
| Date | Buyer | Sale Price | Title Company |
|---|---|---|---|
| Gasca Peter P | -- | None Available | |
| Gasca Peter P | $139,000 | Security Title Agency | |
| Turner Jerry T | $88,000 | Security Title |
Source: Public Records
Mortgage History
| Date | Status | Borrower | Loan Amount |
|---|---|---|---|
| Open | Gasca Peter P | $111,200 | |
| Previous Owner | Turner Jerry T | $89,760 |
Source: Public Records
Tax History Compared to Growth
Tax History
| Year | Tax Paid | Tax Assessment Tax Assessment Total Assessment is a certain percentage of the fair market value that is determined by local assessors to be the total taxable value of land and additions on the property. | Land | Improvement |
|---|---|---|---|---|
| 2025 | $1,271 | $14,901 | -- | -- |
| 2024 | $1,283 | $14,191 | -- | -- |
| 2023 | $1,283 | $32,530 | $6,500 | $26,030 |
| 2022 | $1,248 | $24,280 | $4,850 | $19,430 |
| 2021 | $1,255 | $21,510 | $4,300 | $17,210 |
| 2020 | $1,241 | $19,480 | $3,890 | $15,590 |
| 2019 | $1,142 | $17,730 | $3,540 | $14,190 |
| 2018 | $1,110 | $16,010 | $3,200 | $12,810 |
| 2017 | $1,067 | $14,720 | $2,940 | $11,780 |
| 2016 | $1,044 | $13,900 | $2,780 | $11,120 |
| 2015 | $982 | $13,670 | $2,730 | $10,940 |
Source: Public Records
Map
Nearby Homes
- 1511 W Mesquite St
- 1807 W Mission Dr
- 1821 W Mission Dr
- 2129 N Villas Ln
- 1805 W Cheyenne Dr
- 2615 N Yucca St
- 2103 W Palomino Dr
- 2029 W Shawnee Dr
- 1771 W Mariposa Ct
- 2015 N Villas Ln
- 1224 W Mesquite St
- 1309 W Marlboro Dr
- 1417 W Los Arboles Place
- 1403 W Los Arboles Place
- 2210 N Los Altos Dr
- 2201 N Comanche Dr Unit 1080
- 2201 N Comanche Dr Unit 1104
- 2201 N Comanche Dr Unit 1018
- 2201 N Comanche Dr Unit 1002
- 1203 W Alamo Dr
- 1611 W Nopal Ct
- 1612 W Nopal Dr
- 1700 W Rosal Dr
- 1614 W Nopal Dr
- 1613 W Nopal Ct
- 1702 W Rosal Dr
- 1610 W Nopal Dr
- 1616 W Nopal Dr
- 1704 W Rosal Dr
- 1608 W Nopal Dr
- 1621 W Nopal Ct
- 1706 W Rosal Dr
- 1618 W Nopal Dr
- 1619 W Nopal Ct Unit 18
- 1615 W Nopal Ct
- 1606 W Nopal Dr
- 1708 W Rosal Dr
- 1615 W Citation Ln
- 1617 W Citation Ln
- 1620 W Nopal Dr