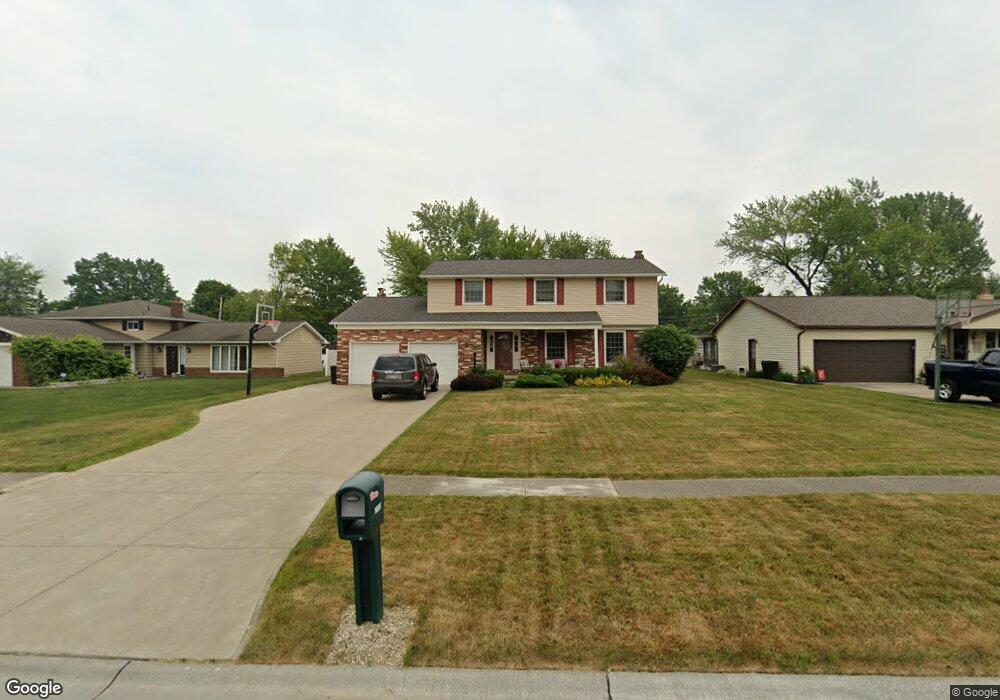
16093 Windsor Dr Strongsville, OH 44136
Estimated Value: $290,000 - $340,000
4
Beds
3
Baths
2,069
Sq Ft
$156/Sq Ft
Est. Value
About This Home
This home is located at 16093 Windsor Dr, Strongsville, OH 44136 and is currently estimated at $321,906, approximately $155 per square foot. 16093 Windsor Dr is a home located in Cuyahoga County with nearby schools including Strongsville High School and Sts Joseph & John Interparochial School.
Ownership History
Date
Name
Owned For
Owner Type
Purchase Details
Closed on
Jul 10, 2025
Sold by
Schaeffer Jonathan G and Schaeffer Mary H
Bought by
Schaeffer Donald D and Schaeffer Iiazel S
Current Estimated Value
Purchase Details
Closed on
Mar 6, 1998
Sold by
Gura Jeffrey A and Gura Vivian M
Bought by
Schaeffer Jonathan G and Schaeffer Mary H
Home Financials for this Owner
Home Financials are based on the most recent Mortgage that was taken out on this home.
Original Mortgage
$120,000
Interest Rate
7.08%
Purchase Details
Closed on
Aug 25, 1993
Sold by
Manning Caroline J
Bought by
Gura Jeffrey A
Purchase Details
Closed on
Jul 24, 1989
Sold by
Manning Johnb
Bought by
Manning Caroline J
Purchase Details
Closed on
Jan 24, 1980
Bought by
Manning Johnb
Purchase Details
Closed on
Oct 1, 1979
Sold by
Geer Dennis H and Geer Karen M
Bought by
Employee Transfer Corp
Purchase Details
Closed on
Jan 1, 1975
Bought by
Geer Dennis H and Geer Karen M
Create a Home Valuation Report for This Property
The Home Valuation Report is an in-depth analysis detailing your home's value as well as a comparison with similar homes in the area
Home Values in the Area
Average Home Value in this Area
Purchase History
| Date | Buyer | Sale Price | Title Company |
|---|---|---|---|
| Schaeffer Donald D | $320,000 | Titleco Title Agency | |
| Schaeffer Jonathan G | $160,000 | National Title Agency | |
| Gura Jeffrey A | $143,900 | -- | |
| Manning Caroline J | -- | -- | |
| Manning Johnb | $86,500 | -- | |
| Employee Transfer Corp | -- | -- | |
| Geer Dennis H | -- | -- |
Source: Public Records
Mortgage History
| Date | Status | Borrower | Loan Amount |
|---|---|---|---|
| Previous Owner | Schaeffer Jonathan G | $120,000 |
Source: Public Records
Tax History
| Year | Tax Paid | Tax Assessment Tax Assessment Total Assessment is a certain percentage of the fair market value that is determined by local assessors to be the total taxable value of land and additions on the property. | Land | Improvement |
|---|---|---|---|---|
| 2025 | $4,831 | $102,900 | $20,300 | $82,600 |
| 2024 | $4,831 | $102,900 | $20,300 | $82,600 |
| 2023 | $4,672 | $74,620 | $18,690 | $55,930 |
| 2022 | $4,638 | $74,620 | $18,690 | $55,930 |
| 2021 | $4,602 | $74,620 | $18,690 | $55,930 |
| 2020 | $4,265 | $61,180 | $15,330 | $45,850 |
| 2019 | $4,140 | $174,800 | $43,800 | $131,000 |
| 2018 | $3,760 | $61,180 | $15,330 | $45,850 |
| 2017 | $3,834 | $57,790 | $11,410 | $46,380 |
| 2016 | $3,803 | $57,790 | $11,410 | $46,380 |
| 2015 | $3,856 | $57,790 | $11,410 | $46,380 |
| 2014 | $3,856 | $57,790 | $11,410 | $46,380 |
Source: Public Records
Map
Nearby Homes
- 15420 Colebright Dr
- 16244 Delmont Ave
- 17761 Shurmer Rd
- 19044 Quail Hollow Dr
- 15446 Drake Rd
- VL Shurmer Rd
- 14686 Drake Rd
- 17163 Golden Star Dr
- 17134 Rabbit Run Dr
- 16524 Timberline Dr
- 18158 Cook Ave
- 17310 Otani Ct
- 18608 Southporte
- 17922 Cambridge Oval
- 13576 Fairwinds Dr
- 17338 Ridge Creek Rd
- 12894 Falling Water Rd
- 17382 W 130th St
- 19496 Echo Dr
- 19595 Cross Trail N
- 16051 Windsor Dr
- 16135 Windsor Dr
- 16179 Windsor Dr
- 16043 Windsor Dr
- 16094 Howe Rd
- 16052 Howe Rd
- 16136 Howe Rd
- 16094 Windsor Dr
- 16180 Howe Rd
- 16044 Howe Rd
- 16052 Windsor Dr
- 16221 Windsor Dr
- 16136 Windsor Dr
- 16003 Windsor Dr
- 16044 Windsor Dr
- 16180 Windsor Dr
- 16222 Howe Rd
- 16002 Howe Rd
- 16229 Windsor Dr
- 16222 Windsor Dr
Your Personal Tour Guide
Ask me questions while you tour the home.