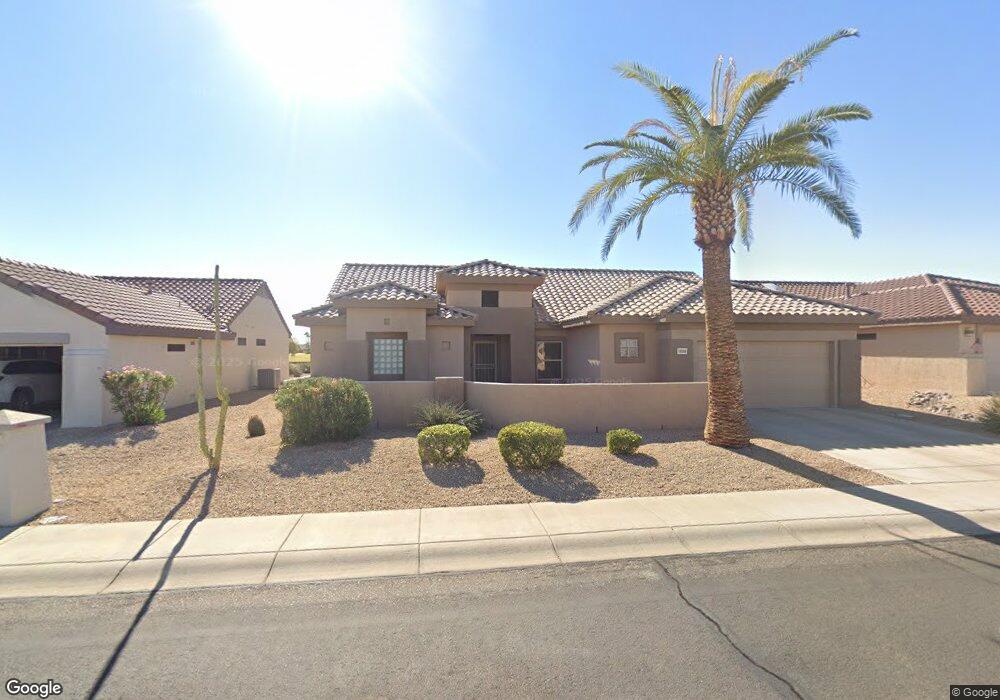
16099 W Starlight Dr Surprise, AZ 85374
Sun City Grand NeighborhoodEstimated Value: $559,256 - $644,000
--
Bed
2
Baths
2,282
Sq Ft
$264/Sq Ft
Est. Value
About This Home
This home is located at 16099 W Starlight Dr, Surprise, AZ 85374 and is currently estimated at $603,314, approximately $264 per square foot. 16099 W Starlight Dr is a home located in Maricopa County with nearby schools including Kingswood Elementary School, Willow Canyon High School, and Cross Christian Academy.
Ownership History
Date
Name
Owned For
Owner Type
Purchase Details
Closed on
Aug 1, 2005
Sold by
Scott Jeffrey T
Bought by
Scott Jeffrey T and Jeffrey T Scott Revocable Trust
Current Estimated Value
Purchase Details
Closed on
May 31, 2005
Sold by
Scott Christine L
Bought by
Scott Jeffrey T
Purchase Details
Closed on
Mar 1, 2002
Sold by
Roth Wayne H and Roth Miriam Anne
Bought by
Scott Jeffrey T and Scott Christine L
Home Financials for this Owner
Home Financials are based on the most recent Mortgage that was taken out on this home.
Original Mortgage
$199,000
Interest Rate
6.84%
Mortgage Type
New Conventional
Purchase Details
Closed on
Apr 30, 1998
Sold by
Taylor Gregory A and Taylor Jennifer J
Bought by
Roth Wayne H and Roth Miriam Anne
Purchase Details
Closed on
Mar 9, 1998
Sold by
Del Webb Communities Inc
Bought by
Taylor Gregory A and Taylor Jennifer J
Create a Home Valuation Report for This Property
The Home Valuation Report is an in-depth analysis detailing your home's value as well as a comparison with similar homes in the area
Home Values in the Area
Average Home Value in this Area
Purchase History
| Date | Buyer | Sale Price | Title Company |
|---|---|---|---|
| Scott Jeffrey T | -- | -- | |
| Scott Jeffrey T | -- | -- | |
| Scott Jeffrey T | $279,000 | First American Title | |
| Roth Wayne H | $229,000 | First American Title | |
| Taylor Gregory A | $198,685 | Sun City Title Agency | |
| Del Webb Communities Inc | -- | Sun City Title Agency |
Source: Public Records
Mortgage History
| Date | Status | Borrower | Loan Amount |
|---|---|---|---|
| Previous Owner | Scott Jeffrey T | $199,000 | |
| Closed | Scott Jeffrey T | $49,300 |
Source: Public Records
Tax History Compared to Growth
Tax History
| Year | Tax Paid | Tax Assessment Tax Assessment Total Assessment is a certain percentage of the fair market value that is determined by local assessors to be the total taxable value of land and additions on the property. | Land | Improvement |
|---|---|---|---|---|
| 2025 | $3,473 | $43,647 | -- | -- |
| 2024 | $3,475 | $41,568 | -- | -- |
| 2023 | $3,475 | $46,780 | $9,350 | $37,430 |
| 2022 | $3,442 | $39,460 | $7,890 | $31,570 |
| 2021 | $3,596 | $36,670 | $7,330 | $29,340 |
| 2020 | $3,557 | $35,470 | $7,090 | $28,380 |
| 2019 | $3,457 | $32,570 | $6,510 | $26,060 |
| 2018 | $3,475 | $32,320 | $6,460 | $25,860 |
| 2017 | $3,201 | $31,070 | $6,210 | $24,860 |
| 2016 | $3,090 | $29,680 | $5,930 | $23,750 |
| 2015 | $2,832 | $27,410 | $5,480 | $21,930 |
Source: Public Records
Map
Nearby Homes
- 20234 N Mariposa Way
- 20143 N Sonoran Ct
- 15979 W Quail Creek Ln
- 16108 W Quail Creek Ln
- 0 W Wildflower Dr Unit 21 6841798
- 16222 W Talara Way
- 15989 W La Paloma Dr
- 16019 W Kino Dr
- 15874 W Wildflower Dr
- 15936 W Kino Dr
- 19951 N Tealstone Dr
- 20304 N Windy Walk Ct
- 20039 N Hearthstone Dr
- 20473 N Desert Sage Ln
- 15766 W Grand Point Ln
- 16115 W Acacia Ct
- 16045 W Autumn Sage Dr
- 15816 W La Paloma Dr
- 19963 N Window Rock Dr
- 15819 W Silver Breeze Dr
- 16105 W Starlight Dr
- 16093 W Starlight Dr
- 16111 W Starlight Dr
- 20204 N Mariposa Way
- 20210 N Mariposa Way
- 20175 N Mariposa Way
- 20169 N Mariposa Way
- 20217 N Sundance Way
- 16117 W Starlight Dr
- 20212 N Sundance Way
- 20163 N Mariposa Way
- 16024 W Starlight Dr
- 20216 N Mariposa Way
- 20218 N Sundance Way
- 16112 W Starlight Dr
- 16123 W Starlight Dr
- 20156 N Sonoran Ct
- 20203 N Mariposa Way
- 20150 N Sonoran Ct
- 20222 N Mariposa Way