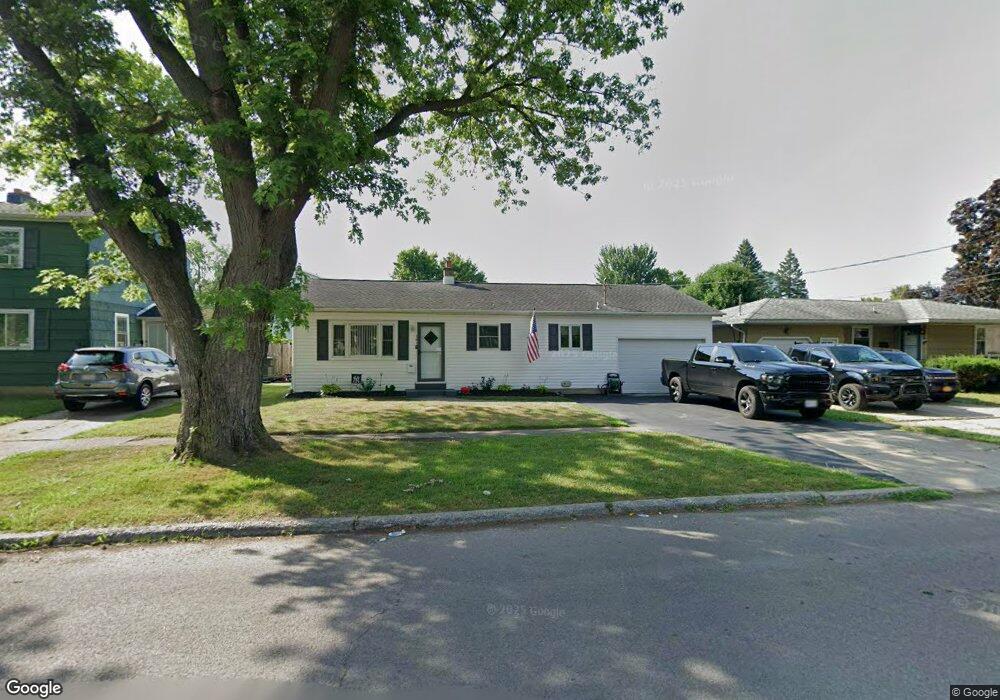
161 17th Ave North Tonawanda, NY 14120
Estimated Value: $215,000 - $246,438
3
Beds
1
Bath
936
Sq Ft
$249/Sq Ft
Est. Value
About This Home
This home is located at 161 17th Ave, North Tonawanda, NY 14120 and is currently estimated at $232,610, approximately $248 per square foot. 161 17th Ave is a home located in Niagara County with nearby schools including Drake School, St Matthew Lutheran School, and St. John Lutheran School.
Ownership History
Date
Name
Owned For
Owner Type
Purchase Details
Closed on
Dec 7, 2020
Sold by
Riley Michael
Bought by
Awad Michael E
Current Estimated Value
Home Financials for this Owner
Home Financials are based on the most recent Mortgage that was taken out on this home.
Original Mortgage
$144,780
Outstanding Balance
$129,127
Interest Rate
2.8%
Mortgage Type
New Conventional
Estimated Equity
$103,483
Purchase Details
Closed on
Aug 31, 2020
Sold by
Soldano Leonard M and Estate Of Leonard Soldano
Bought by
Riley Michael
Purchase Details
Closed on
Aug 29, 2008
Sold by
Bull James
Bought by
Soldano Leonard
Purchase Details
Closed on
Sep 26, 2005
Sold by
Helen Streck Estate
Bought by
Bull James
Home Financials for this Owner
Home Financials are based on the most recent Mortgage that was taken out on this home.
Original Mortgage
$67,500
Interest Rate
8.37%
Mortgage Type
Amount Keyed Is An Aggregate Amount
Create a Home Valuation Report for This Property
The Home Valuation Report is an in-depth analysis detailing your home's value as well as a comparison with similar homes in the area
Home Values in the Area
Average Home Value in this Area
Purchase History
| Date | Buyer | Sale Price | Title Company |
|---|---|---|---|
| Awad Michael E | $152,500 | None Available | |
| Riley Michael | $80,000 | None Available | |
| Soldano Leonard | $87,000 | Anne Evans | |
| Bull James | $67,500 | Gregory J Perla |
Source: Public Records
Mortgage History
| Date | Status | Borrower | Loan Amount |
|---|---|---|---|
| Open | Awad Michael E | $144,780 | |
| Previous Owner | Bull James | $67,500 |
Source: Public Records
Tax History Compared to Growth
Tax History
| Year | Tax Paid | Tax Assessment Tax Assessment Total Assessment is a certain percentage of the fair market value that is determined by local assessors to be the total taxable value of land and additions on the property. | Land | Improvement |
|---|---|---|---|---|
| 2024 | $3,531 | $100,000 | $15,600 | $84,400 |
| 2023 | $3,443 | $100,000 | $15,600 | $84,400 |
| 2022 | $3,405 | $100,000 | $15,600 | $84,400 |
| 2021 | $3,383 | $100,000 | $15,600 | $84,400 |
| 2020 | $1,696 | $87,000 | $15,600 | $71,400 |
| 2019 | $1,554 | $87,000 | $15,600 | $71,400 |
| 2018 | $1,613 | $87,000 | $15,600 | $71,400 |
| 2017 | $1,554 | $87,000 | $15,600 | $71,400 |
| 2016 | $1,219 | $87,000 | $15,600 | $71,400 |
| 2015 | -- | $87,000 | $15,600 | $71,400 |
| 2014 | -- | $87,000 | $15,600 | $71,400 |
Source: Public Records
Map
Nearby Homes