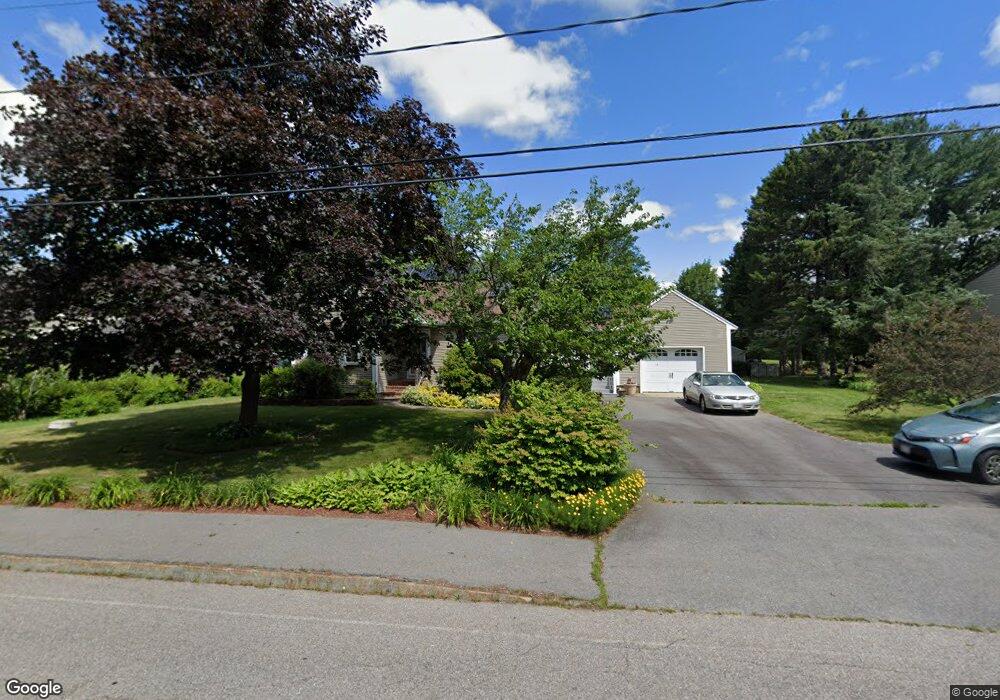
161 Birch St Bridgewater, MA 02324
Estimated Value: $597,000 - $640,000
3
Beds
3
Baths
1,760
Sq Ft
$352/Sq Ft
Est. Value
About This Home
This home is located at 161 Birch St, Bridgewater, MA 02324 and is currently estimated at $619,485, approximately $351 per square foot. 161 Birch St is a home located in Plymouth County with nearby schools including Mitchell Elementary School, Williams Intermediate School, and Bridgewater Middle School.
Ownership History
Date
Name
Owned For
Owner Type
Purchase Details
Closed on
Feb 27, 2004
Sold by
Coelho Ft
Bought by
Ferguson Alan and Ferguson Nancy C
Current Estimated Value
Home Financials for this Owner
Home Financials are based on the most recent Mortgage that was taken out on this home.
Original Mortgage
$410,000
Outstanding Balance
$191,347
Interest Rate
5.65%
Mortgage Type
Purchase Money Mortgage
Estimated Equity
$428,138
Create a Home Valuation Report for This Property
The Home Valuation Report is an in-depth analysis detailing your home's value as well as a comparison with similar homes in the area
Home Values in the Area
Average Home Value in this Area
Purchase History
| Date | Buyer | Sale Price | Title Company |
|---|---|---|---|
| Ferguson Alan | $344,900 | -- |
Source: Public Records
Mortgage History
| Date | Status | Borrower | Loan Amount |
|---|---|---|---|
| Open | Ferguson Alan | $207,850 | |
| Closed | Ferguson Alan | $30,000 | |
| Open | Ferguson Alan | $410,000 | |
| Previous Owner | Ferguson Alan | $120,000 |
Source: Public Records
Tax History Compared to Growth
Tax History
| Year | Tax Paid | Tax Assessment Tax Assessment Total Assessment is a certain percentage of the fair market value that is determined by local assessors to be the total taxable value of land and additions on the property. | Land | Improvement |
|---|---|---|---|---|
| 2025 | $6,292 | $531,900 | $186,500 | $345,400 |
| 2024 | $6,093 | $501,900 | $177,600 | $324,300 |
| 2023 | $6,026 | $469,300 | $166,000 | $303,300 |
| 2022 | $5,903 | $412,200 | $145,600 | $266,600 |
| 2021 | $5,332 | $368,200 | $130,000 | $238,200 |
| 2020 | $5,220 | $354,400 | $125,000 | $229,400 |
| 2019 | $5,140 | $346,600 | $125,000 | $221,600 |
| 2018 | $4,829 | $317,900 | $115,300 | $202,600 |
| 2017 | $4,628 | $296,500 | $115,300 | $181,200 |
| 2016 | $4,427 | $284,900 | $113,100 | $171,800 |
| 2015 | $4,421 | $272,200 | $109,800 | $162,400 |
| 2014 | $4,204 | $258,700 | $100,900 | $157,800 |
Source: Public Records
Map
Nearby Homes
- 331 North St
- Lot 2 Fontana Way
- 8 North St
- 10 College Rd
- 74 Mount Prospect St
- 180 Main St Unit 2208
- 180 Main St Unit A15
- 180 Main St Unit A5
- 180 Main St Unit C55
- 18 Aldrich Rd
- 116 Center St
- 10 Duck Farm Ln
- 165 Grange Park
- 74 Vernon St
- 130 Maple Ave
- 16 Cassidy Place Unit 16
- Lot 3 Fontana Way
- 158 Rowayne Park
- 220 Bedford St Unit D-5
- 464-466 Main St