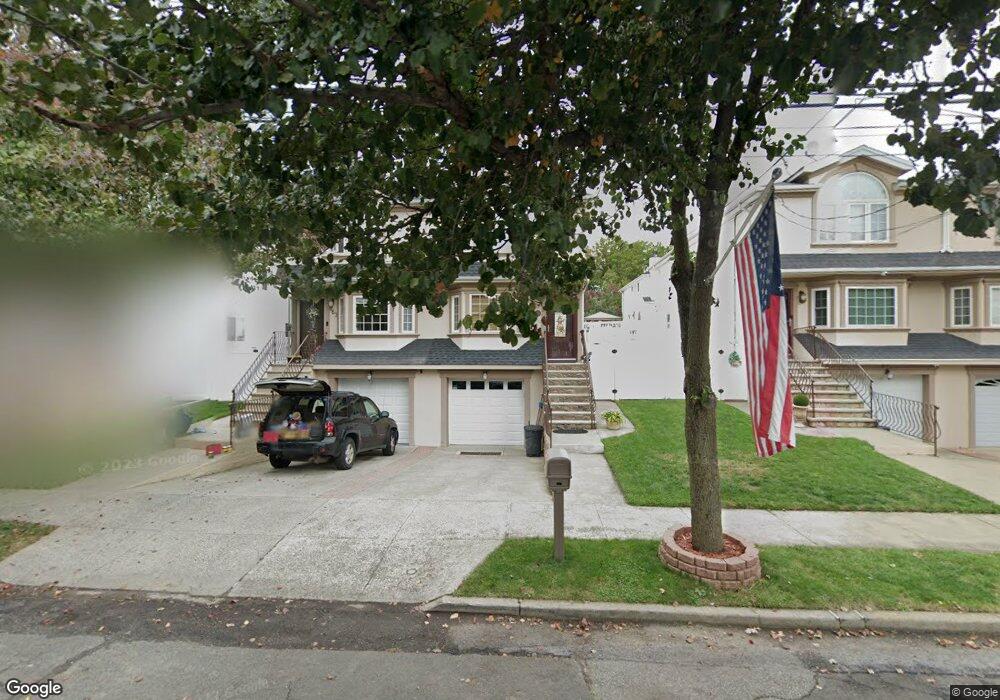
161 Camden Ave Staten Island, NY 10309
Tottenville NeighborhoodEstimated Value: $791,448 - $844,000
--
Bed
4
Baths
1,530
Sq Ft
$535/Sq Ft
Est. Value
About This Home
This home is located at 161 Camden Ave, Staten Island, NY 10309 and is currently estimated at $818,112, approximately $534 per square foot. 161 Camden Ave is a home located in Richmond County with nearby schools including P.S. 6 Cpl Allan F Kivlehan School, Is 34 Tottenville, and Tottenville High School.
Ownership History
Date
Name
Owned For
Owner Type
Purchase Details
Closed on
Dec 20, 2001
Sold by
Chase Construction Corp
Bought by
Ocasio Edwin and Ocasio Jacqueline
Current Estimated Value
Home Financials for this Owner
Home Financials are based on the most recent Mortgage that was taken out on this home.
Original Mortgage
$265,600
Outstanding Balance
$107,399
Interest Rate
7.04%
Estimated Equity
$710,713
Create a Home Valuation Report for This Property
The Home Valuation Report is an in-depth analysis detailing your home's value as well as a comparison with similar homes in the area
Home Values in the Area
Average Home Value in this Area
Purchase History
| Date | Buyer | Sale Price | Title Company |
|---|---|---|---|
| Ocasio Edwin | $337,000 | -- |
Source: Public Records
Mortgage History
| Date | Status | Borrower | Loan Amount |
|---|---|---|---|
| Open | Ocasio Edwin | $265,600 |
Source: Public Records
Tax History Compared to Growth
Tax History
| Year | Tax Paid | Tax Assessment Tax Assessment Total Assessment is a certain percentage of the fair market value that is determined by local assessors to be the total taxable value of land and additions on the property. | Land | Improvement |
|---|---|---|---|---|
| 2025 | $8,168 | $48,960 | $7,432 | $41,528 |
| 2024 | $8,180 | $43,920 | $7,816 | $36,104 |
| 2023 | $7,775 | $39,686 | $7,065 | $32,621 |
| 2022 | $7,187 | $43,560 | $8,160 | $35,400 |
| 2021 | $7,531 | $40,320 | $8,160 | $32,160 |
| 2020 | $7,569 | $39,240 | $8,160 | $31,080 |
| 2019 | $7,041 | $38,760 | $8,160 | $30,600 |
| 2018 | $6,444 | $33,072 | $7,572 | $25,500 |
| 2017 | $6,060 | $31,200 | $8,160 | $23,040 |
| 2016 | $5,891 | $31,020 | $8,160 | $22,860 |
| 2015 | $5,858 | $31,005 | $6,168 | $24,837 |
| 2014 | $5,858 | $32,112 | $6,388 | $25,724 |
Source: Public Records
Map
Nearby Homes
- 158 Camden Ave
- 7 Irene Ln
- 5 Haywood St
- 43 Lerer Ln
- 527 Page Ave
- 23 Haywood St
- 230 Bedell Ave
- 35 Jeffrey Place
- 215 Clearmont Ave
- 101 Bedell Ave
- 6 Kathleen Ct
- 27 Honey Ln
- 89 Joline Ave
- 200 Cheevers Ln
- 36 Adlers Ln
- 90 Giegerich Ave
- 43 Ottavio Promenade
- 74 Ottavio Promenade
- 72 Giegerich Ave
- 64 Ottavio Promenade