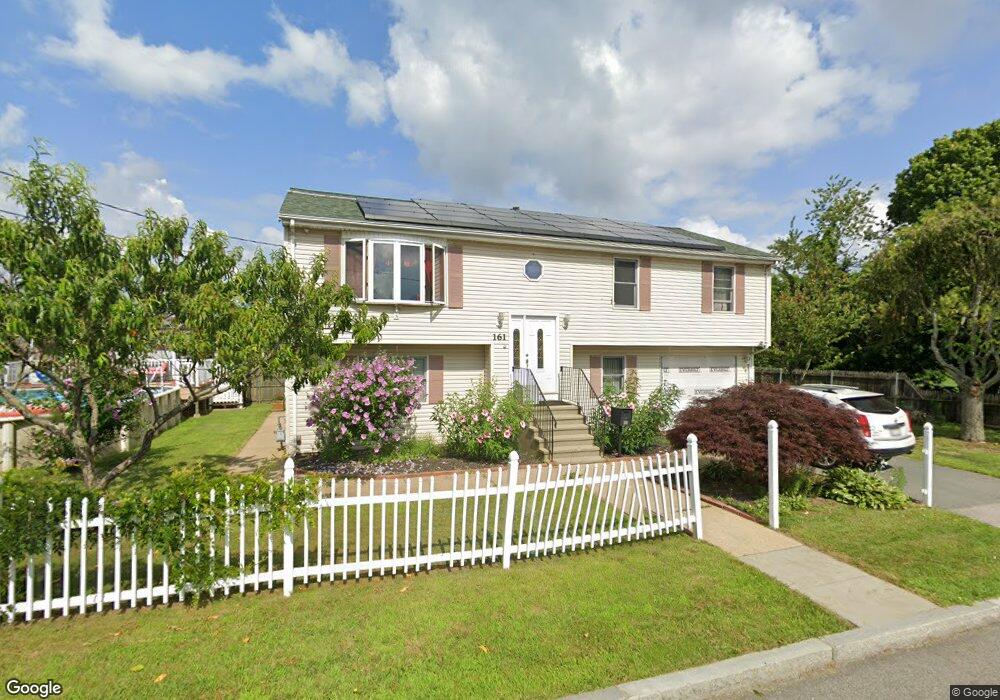
161 Carl St Fall River, MA 02721
Maplewood NeighborhoodEstimated Value: $516,000 - $606,000
3
Beds
2
Baths
1,826
Sq Ft
$301/Sq Ft
Est. Value
About This Home
This home is located at 161 Carl St, Fall River, MA 02721 and is currently estimated at $549,110, approximately $300 per square foot. 161 Carl St is a home located in Bristol County with nearby schools including Letourneau Elementary School, Matthew J. Kuss Middle School, and B M C Durfee High School.
Ownership History
Date
Name
Owned For
Owner Type
Purchase Details
Closed on
Jun 30, 2010
Sold by
Sousa Paulo M and Sousa Carla C
Bought by
Whipp Patrick and Whipp Kathleen J
Current Estimated Value
Home Financials for this Owner
Home Financials are based on the most recent Mortgage that was taken out on this home.
Original Mortgage
$242,731
Outstanding Balance
$162,583
Interest Rate
4.88%
Mortgage Type
Purchase Money Mortgage
Estimated Equity
$386,527
Purchase Details
Closed on
Nov 16, 1999
Sold by
Family Homes Const Co
Bought by
Sousa Paulo M and Sousa Carla C
Home Financials for this Owner
Home Financials are based on the most recent Mortgage that was taken out on this home.
Original Mortgage
$130,100
Interest Rate
7.68%
Mortgage Type
Purchase Money Mortgage
Create a Home Valuation Report for This Property
The Home Valuation Report is an in-depth analysis detailing your home's value as well as a comparison with similar homes in the area
Home Values in the Area
Average Home Value in this Area
Purchase History
| Date | Buyer | Sale Price | Title Company |
|---|---|---|---|
| Whipp Patrick | $246,000 | -- | |
| Sousa Paulo M | $137,000 | -- |
Source: Public Records
Mortgage History
| Date | Status | Borrower | Loan Amount |
|---|---|---|---|
| Open | Whipp Patrick | $242,731 | |
| Previous Owner | Sousa Paulo M | $30,000 | |
| Previous Owner | Sousa Paulo M | $130,000 | |
| Previous Owner | Sousa Paulo M | $130,100 |
Source: Public Records
Tax History Compared to Growth
Tax History
| Year | Tax Paid | Tax Assessment Tax Assessment Total Assessment is a certain percentage of the fair market value that is determined by local assessors to be the total taxable value of land and additions on the property. | Land | Improvement |
|---|---|---|---|---|
| 2025 | $4,997 | $436,400 | $128,400 | $308,000 |
| 2024 | $4,444 | $386,800 | $123,500 | $263,300 |
| 2023 | $4,448 | $362,500 | $105,900 | $256,600 |
| 2022 | $3,849 | $305,000 | $96,300 | $208,700 |
| 2021 | $3,856 | $278,800 | $89,100 | $189,700 |
| 2020 | $3,748 | $259,400 | $85,300 | $174,100 |
| 2019 | $3,715 | $254,800 | $81,200 | $173,600 |
| 2018 | $3,537 | $241,900 | $79,700 | $162,200 |
| 2017 | $3,389 | $242,100 | $81,300 | $160,800 |
| 2016 | $3,035 | $222,700 | $84,700 | $138,000 |
| 2015 | $2,919 | $223,200 | $81,500 | $141,700 |
| 2014 | $2,862 | $227,500 | $85,800 | $141,700 |
Source: Public Records
Map
Nearby Homes