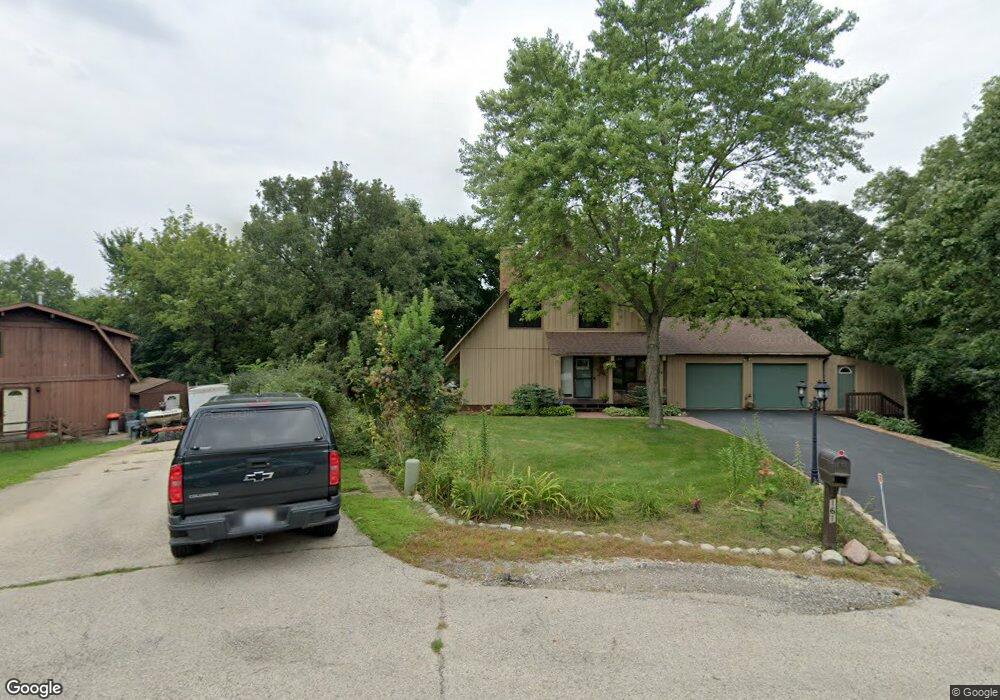
161 Castlewood Dr Carpentersville, IL 60110
Estimated Value: $281,000 - $398,000
3
Beds
3
Baths
1,700
Sq Ft
$214/Sq Ft
Est. Value
About This Home
This home is located at 161 Castlewood Dr, Carpentersville, IL 60110 and is currently estimated at $363,463, approximately $213 per square foot. 161 Castlewood Dr is a home located in Kane County with nearby schools including Parkview Elementary School, Crescent City Grade School, and Carpentersville Middle School.
Ownership History
Date
Name
Owned For
Owner Type
Purchase Details
Closed on
Mar 6, 2017
Sold by
Combs Stephen M
Bought by
Bert Steven V and Bert Linda G
Current Estimated Value
Home Financials for this Owner
Home Financials are based on the most recent Mortgage that was taken out on this home.
Original Mortgage
$212,000
Outstanding Balance
$175,997
Interest Rate
4.21%
Mortgage Type
New Conventional
Estimated Equity
$187,466
Purchase Details
Closed on
Mar 14, 2012
Sold by
Combs Stephen and Combs Marisa
Bought by
Combs Stephen M and Stephen M Combs Revocable Living Trust
Purchase Details
Closed on
Nov 17, 2009
Sold by
Vinz Roger H and Vinz Irene Frea
Bought by
Combs Stephen and Combs Marisa
Purchase Details
Closed on
Aug 18, 2000
Sold by
Vinz Roger H and Vinz Irene F
Bought by
Vinz Roger H and Vinz Irene Frea
Create a Home Valuation Report for This Property
The Home Valuation Report is an in-depth analysis detailing your home's value as well as a comparison with similar homes in the area
Home Values in the Area
Average Home Value in this Area
Purchase History
| Date | Buyer | Sale Price | Title Company |
|---|---|---|---|
| Bert Steven V | $262,000 | First American Title | |
| Combs Stephen M | -- | None Available | |
| Combs Stephen | $237,500 | Baird & Warner Title Service | |
| Vinz Roger H | -- | -- |
Source: Public Records
Mortgage History
| Date | Status | Borrower | Loan Amount |
|---|---|---|---|
| Open | Bert Steven V | $212,000 |
Source: Public Records
Tax History Compared to Growth
Tax History
| Year | Tax Paid | Tax Assessment Tax Assessment Total Assessment is a certain percentage of the fair market value that is determined by local assessors to be the total taxable value of land and additions on the property. | Land | Improvement |
|---|---|---|---|---|
| 2024 | $6,874 | $103,622 | $23,391 | $80,231 |
| 2023 | $6,410 | $93,235 | $21,046 | $72,189 |
| 2022 | $6,931 | $94,785 | $21,046 | $73,739 |
| 2021 | $6,716 | $89,496 | $19,872 | $69,624 |
| 2020 | $6,577 | $87,484 | $19,425 | $68,059 |
| 2019 | $6,382 | $83,049 | $18,440 | $64,609 |
| 2018 | $5,552 | $71,156 | $18,075 | $53,081 |
| 2017 | $5,303 | $66,563 | $16,908 | $49,655 |
| 2016 | $4,975 | $59,538 | $17,527 | $42,011 |
| 2015 | -- | $55,789 | $16,423 | $39,366 |
| 2014 | -- | $54,248 | $15,969 | $38,279 |
| 2013 | -- | $55,909 | $16,458 | $39,451 |
Source: Public Records
Map
Nearby Homes
- 171 Lake Shore Dr
- 181 Skyline Dr
- 149 Austin Ave
- 200 Amarillo Dr
- 105 Siesta Rd
- 308 Amarillo Ct
- 327 Tulsa Ave
- 1426 Kings Rd
- 494 Rosewood Dr
- 1040 Rosewood Dr
- 1317 Brookdale Dr
- 7 Austin Ave
- 4 Austin Ave
- 496 Oakhurst Ln
- 140 Hickory Dr
- 1244 Brookdale Dr
- 405 Windham Trail
- 1431 Silverstone Dr Unit 1416
- 1033 Rosewood Dr
- 1017 Brookdale Dr Unit 1017
- 159 Castlewood Dr
- 265 Melody Ln
- 158 Castlewood Dr
- 263 Melody Ln
- 154 Castlewood Dr
- 271 Melody Ln
- 151 Castlewood Dr
- 103 Kings Rd Unit 1
- 279 Melody Ln
- 142 Castlewood Dr
- 141 Castlewood Dr
- 255 Melody Ln
- 272 Melody Ln
- 260 Melody Ln Unit 1
- 138 Castlewood Dr
- 251 Melody Ln
- 113 Kings Rd
- 134 Castlewood Dr Unit 1
- 975 Williams Rd
- Lot Castlewood Dr