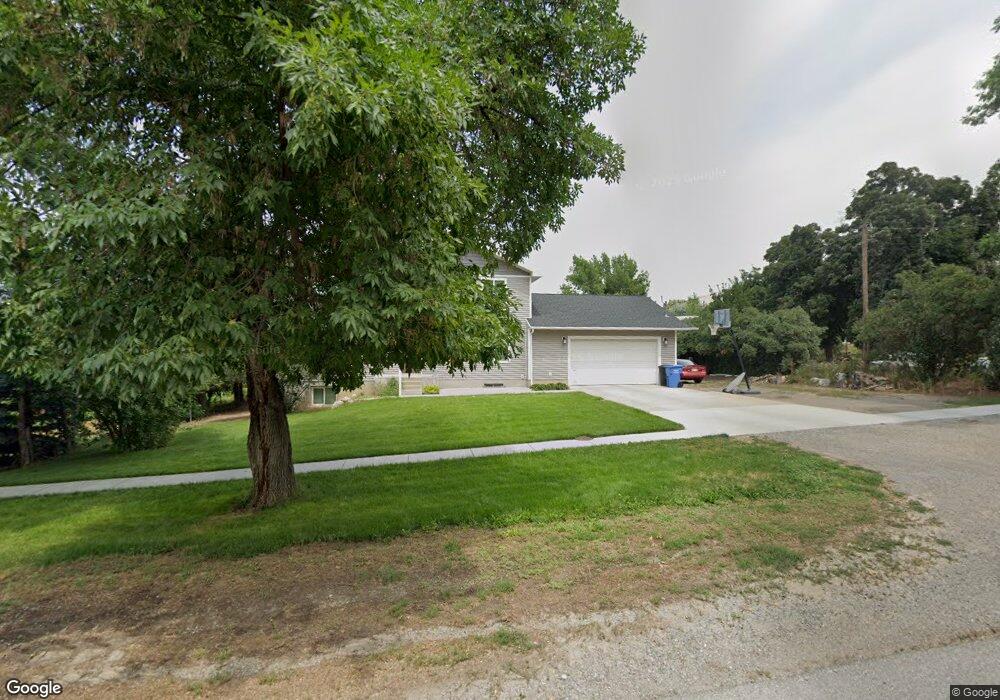
161 E 200 N Hyde Park, UT 84318
Estimated Value: $540,000 - $595,000
6
Beds
3
Baths
3,188
Sq Ft
$181/Sq Ft
Est. Value
About This Home
This home is located at 161 E 200 N, Hyde Park, UT 84318 and is currently estimated at $577,324, approximately $181 per square foot. 161 E 200 N is a home located in Cache County with nearby schools including Summit School, Cedar Ridge School, and North Cache Middle School.
Ownership History
Date
Name
Owned For
Owner Type
Purchase Details
Closed on
Jul 22, 2016
Sold by
Crookston Edward L and Crookston Bonnie L
Bought by
Holt Michael and Holt Shara
Current Estimated Value
Home Financials for this Owner
Home Financials are based on the most recent Mortgage that was taken out on this home.
Original Mortgage
$204,000
Outstanding Balance
$161,883
Interest Rate
3.48%
Mortgage Type
New Conventional
Estimated Equity
$415,441
Purchase Details
Closed on
Jul 13, 2016
Sold by
Reeder Lois W
Bought by
Crookston Edward L and Crookston Bonnie L
Home Financials for this Owner
Home Financials are based on the most recent Mortgage that was taken out on this home.
Original Mortgage
$204,000
Outstanding Balance
$161,883
Interest Rate
3.48%
Mortgage Type
New Conventional
Estimated Equity
$415,441
Create a Home Valuation Report for This Property
The Home Valuation Report is an in-depth analysis detailing your home's value as well as a comparison with similar homes in the area
Home Values in the Area
Average Home Value in this Area
Purchase History
| Date | Buyer | Sale Price | Title Company |
|---|---|---|---|
| Holt Michael | -- | Pinnacle Title | |
| Crookston Edward L | -- | Pinnacle Title |
Source: Public Records
Mortgage History
| Date | Status | Borrower | Loan Amount |
|---|---|---|---|
| Open | Holt Michael | $204,000 |
Source: Public Records
Tax History
| Year | Tax Paid | Tax Assessment Tax Assessment Total Assessment is a certain percentage of the fair market value that is determined by local assessors to be the total taxable value of land and additions on the property. | Land | Improvement |
|---|---|---|---|---|
| 2025 | $2,075 | $286,140 | $0 | $0 |
| 2024 | $2,209 | $280,870 | $0 | $0 |
| 2023 | $2,296 | $277,630 | $0 | $0 |
| 2022 | $2,388 | $277,630 | $0 | $0 |
| 2021 | $2,229 | $407,080 | $81,400 | $325,680 |
| 2020 | $2,031 | $352,800 | $81,400 | $271,400 |
| 2019 | $2,017 | $332,500 | $81,400 | $251,100 |
| 2018 | $1,727 | $279,168 | $62,000 | $217,168 |
| 2017 | $1,654 | $140,745 | $0 | $0 |
| 2016 | $1,678 | $115,445 | $0 | $0 |
| 2015 | $1,362 | $115,445 | $0 | $0 |
| 2014 | $1,262 | $109,810 | $0 | $0 |
| 2013 | -- | $110,895 | $0 | $0 |
Source: Public Records
Map
Nearby Homes
- 1138 E 200 N Unit 37
- 1124 E 200 N Unit 38
- 291 N Main St
- 375 N 400 E
- 455 N 350 E
- 895 E 100 N Unit 11
- 164 E 200 S
- 275 W 260 N
- 520 E 100 S
- 1110 E 100 S Unit 216
- 600 E 100 S
- 275 W 60 S
- 76 W 200 S
- 458 W Madison St S
- 1130 E 245 N
- 201 N 1000 E Unit 19
- 1109 E 245 N
- 830 E 410 N Unit 161
- 635 S 125 E Unit 120
- 454 W Madison St S
- 1137 E 200 N Unit 37
- 1138 E 200 N
- 1112 E 200 N Unit 39
- 1153 E 200 N Unit 43
- 1137 E 200 N Unit 42
- 1123 E 200 N Unit 41
- 1152 E 200 N Unit 36
- 1108 E 200 N Unit 39
- 1083 E 200 N Unit 29
- 1109 E 200 N Unit 40
- 195 E 200 N
- 129 E 200 N
- 158 E 200 N
- 140 E 200 N
- 192 E 200 N
- 160 E 200 N
- 105 E 200 N
- 226 N 100 E
- 206 N 200 E
- 255 N 200 E
Your Personal Tour Guide
Ask me questions while you tour the home.