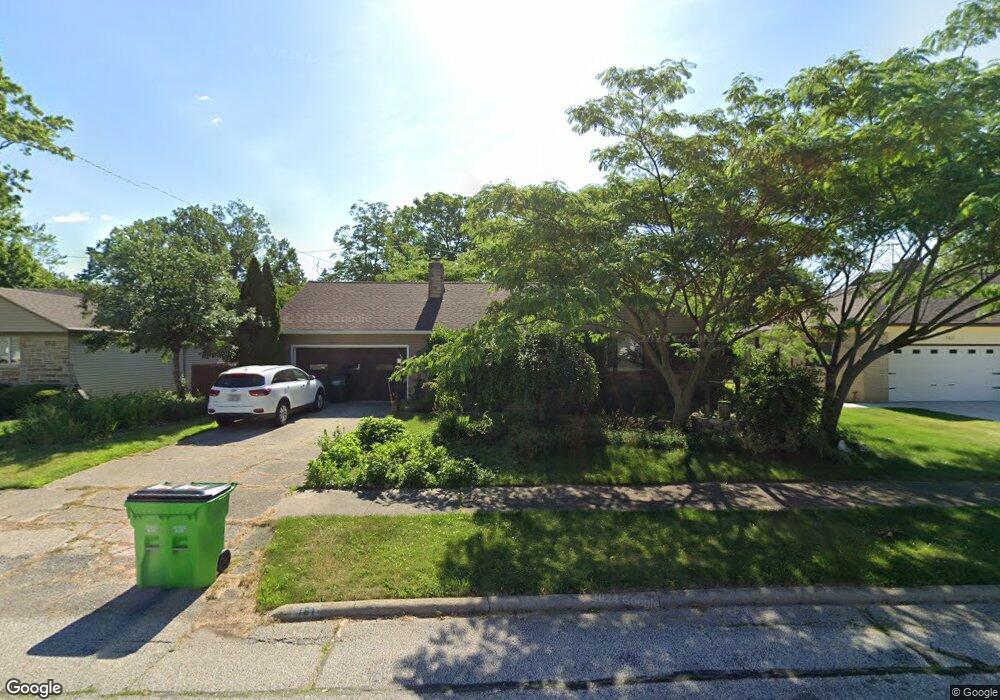
161 E 265th St Euclid, OH 44132
Estimated Value: $163,000 - $216,000
3
Beds
3
Baths
1,440
Sq Ft
$132/Sq Ft
Est. Value
About This Home
This home is located at 161 E 265th St, Euclid, OH 44132 and is currently estimated at $189,603, approximately $131 per square foot. 161 E 265th St is a home located in Cuyahoga County with nearby schools including Shoreview Elementary School, Euclid High School, and Ss Robert & William Catholic School.
Ownership History
Date
Name
Owned For
Owner Type
Purchase Details
Closed on
Jul 25, 2005
Sold by
Rongina Investors Ltd
Bought by
Harder Melvin C and Harder Trudy
Current Estimated Value
Home Financials for this Owner
Home Financials are based on the most recent Mortgage that was taken out on this home.
Original Mortgage
$133,200
Outstanding Balance
$70,331
Interest Rate
5.74%
Mortgage Type
Fannie Mae Freddie Mac
Estimated Equity
$119,272
Purchase Details
Closed on
May 13, 2005
Sold by
Schlobohm Linnea C and Schlobohm John E
Bought by
Rongina Investors Ltd
Home Financials for this Owner
Home Financials are based on the most recent Mortgage that was taken out on this home.
Original Mortgage
$500,000
Outstanding Balance
$264,211
Interest Rate
6.05%
Mortgage Type
Construction
Estimated Equity
-$74,608
Purchase Details
Closed on
Jan 1, 1975
Bought by
Berntson Harry G and Berntson Lydia A
Create a Home Valuation Report for This Property
The Home Valuation Report is an in-depth analysis detailing your home's value as well as a comparison with similar homes in the area
Home Values in the Area
Average Home Value in this Area
Purchase History
| Date | Buyer | Sale Price | Title Company |
|---|---|---|---|
| Harder Melvin C | $166,500 | Progressive Land Title Ag | |
| Rongina Investors Ltd | $112,000 | Progressive Land Title Ag | |
| Berntson Harry G | -- | -- |
Source: Public Records
Mortgage History
| Date | Status | Borrower | Loan Amount |
|---|---|---|---|
| Open | Harder Melvin C | $133,200 | |
| Open | Rongina Investors Ltd | $500,000 |
Source: Public Records
Tax History
| Year | Tax Paid | Tax Assessment Tax Assessment Total Assessment is a certain percentage of the fair market value that is determined by local assessors to be the total taxable value of land and additions on the property. | Land | Improvement |
|---|---|---|---|---|
| 2024 | $3,808 | $65,380 | $12,600 | $52,780 |
| 2023 | $3,067 | $44,560 | $10,430 | $34,130 |
| 2022 | $3,031 | $44,560 | $10,430 | $34,130 |
| 2021 | $3,378 | $44,560 | $10,430 | $34,130 |
| 2020 | $3,365 | $41,270 | $9,660 | $31,610 |
| 2019 | $3,028 | $117,900 | $27,600 | $90,300 |
| 2018 | $3,187 | $41,270 | $9,660 | $31,610 |
| 2017 | $3,593 | $40,810 | $8,260 | $32,550 |
| 2016 | $3,601 | $40,810 | $8,260 | $32,550 |
| 2015 | $3,275 | $40,810 | $8,260 | $32,550 |
| 2014 | $3,275 | $40,810 | $8,260 | $32,550 |
Source: Public Records
Map
Nearby Homes
- 25801 Lake Shore Blvd Unit 29
- 25801 Lake Shore Blvd Unit 25
- 25801 Lake Shore Blvd Unit 112
- 25801 Lake Shore Blvd Unit 85
- 25801 Lakeshore Blvd Unit 42
- 325 E 264th St
- 27175 Cameron Ave
- 411 E 270th St
- 440 E 271st St
- 150 Westbrook Dr
- 325 E 257th St
- 340 E 257th St
- 355 E 257th St
- 141 Eastbrook Dr
- 110 E 252nd St
- 625 Lloyd Rd
- 27430 Forestview Ave
- 27125 Mallard Ave
- 28525 Lakeshore Blvd
- 26831 Shoreview Ave
- 155 E 265th St
- 165 E 265th St
- 160 E 267th St
- 150 E 267th St
- 170 E 267th St
- 160 E 265th St
- 151 E 265th St
- 171 E 265th St
- 146 E 267th St
- 180 E 267th St
- 154 E 265th St
- 164 E 265th St
- 140 E 267th St
- 150 E 265th St
- 170 E 265th St
- 136 E 267th St
- 145 E 265th St
- 175 E 265th St
- 26601 Lake Shore Blvd
- 151 E 264th St
Your Personal Tour Guide
Ask me questions while you tour the home.