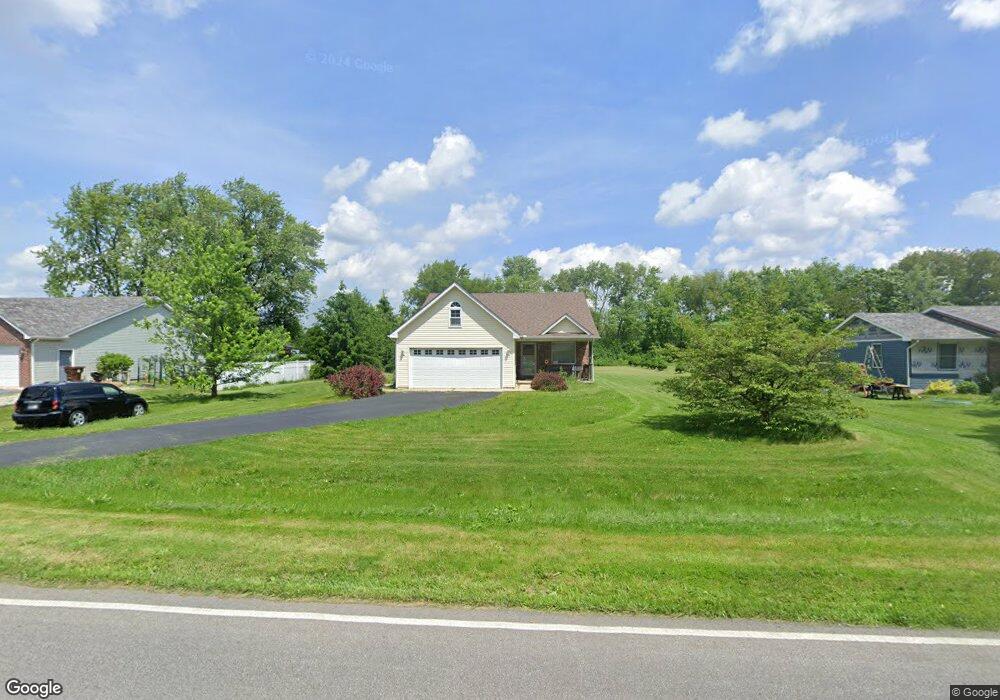
161 E 400 S Valparaiso, IN 46383
Porter County NeighborhoodEstimated Value: $319,000 - $354,137
4
Beds
3
Baths
1,252
Sq Ft
$269/Sq Ft
Est. Value
About This Home
This home is located at 161 E 400 S, Valparaiso, IN 46383 and is currently estimated at $336,534, approximately $268 per square foot. 161 E 400 S is a home located in Porter County with nearby schools including Morgan Township Elementary School, Morgan Township Middle/High School, and Midwest Academy.
Ownership History
Date
Name
Owned For
Owner Type
Purchase Details
Closed on
Aug 25, 2005
Sold by
Frevenberger Aaron
Bought by
Johnson Regin M and Johnson Kelly J
Current Estimated Value
Home Financials for this Owner
Home Financials are based on the most recent Mortgage that was taken out on this home.
Original Mortgage
$155,000
Outstanding Balance
$83,134
Interest Rate
5.89%
Mortgage Type
Fannie Mae Freddie Mac
Estimated Equity
$253,400
Create a Home Valuation Report for This Property
The Home Valuation Report is an in-depth analysis detailing your home's value as well as a comparison with similar homes in the area
Home Values in the Area
Average Home Value in this Area
Purchase History
| Date | Buyer | Sale Price | Title Company |
|---|---|---|---|
| Johnson Regin M | -- | Ticor Title Insurance |
Source: Public Records
Mortgage History
| Date | Status | Borrower | Loan Amount |
|---|---|---|---|
| Open | Johnson Regin M | $155,000 |
Source: Public Records
Tax History
| Year | Tax Paid | Tax Assessment Tax Assessment Total Assessment is a certain percentage of the fair market value that is determined by local assessors to be the total taxable value of land and additions on the property. | Land | Improvement |
|---|---|---|---|---|
| 2024 | $2,152 | $343,200 | $37,000 | $306,200 |
| 2023 | $2,087 | $313,100 | $32,500 | $280,600 |
| 2022 | $1,947 | $283,300 | $32,500 | $250,800 |
| 2021 | $1,897 | $252,600 | $32,500 | $220,100 |
| 2020 | $1,695 | $230,100 | $28,300 | $201,800 |
| 2019 | $1,564 | $208,500 | $28,300 | $180,200 |
| 2018 | $1,465 | $200,400 | $28,300 | $172,100 |
| 2017 | $1,434 | $199,400 | $28,300 | $171,100 |
| 2016 | $1,299 | $188,100 | $28,900 | $159,200 |
| 2014 | $1,235 | $177,400 | $28,000 | $149,400 |
| 2013 | -- | $169,000 | $28,300 | $140,700 |
Source: Public Records
Map
Nearby Homes
- 334 S State Road 49
- 296 S 150 E
- 181 E 600 S
- 355 E 300 S
- 645 S 150 E
- 456 E 400 S
- 323 E 124 S
- 829 S Baums Bridge Rd
- 0 Smoke Rd
- 103 Mckinley St
- 204 N Main St
- Lot B4-5 St Road 8
- 48 E Division Rd
- 401 Sutton Ave
- 401 S Sutton Ave
- 3253 Mockingbird Ln
- 3252 Mockingbird Ln
- 3251 Mockingbird Ln
- 421 Amy Rose Ln
- 372 Radcliff Dr
Your Personal Tour Guide
Ask me questions while you tour the home.