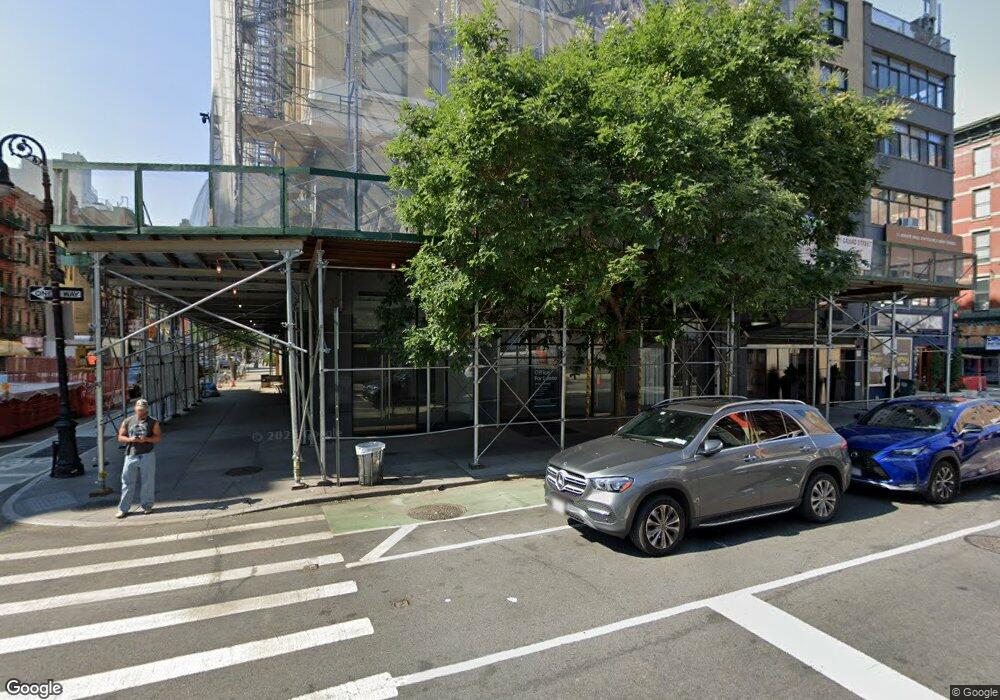
161 Grand St Unit 2A New York, NY 10013
SoHo NeighborhoodEstimated Value: $2,502,656 - $3,570,000
--
Bed
--
Bath
1,832
Sq Ft
$1,720/Sq Ft
Est. Value
About This Home
This home is located at 161 Grand St Unit 2A, New York, NY 10013 and is currently estimated at $3,150,414, approximately $1,719 per square foot. 161 Grand St Unit 2A is a home located in New York County with nearby schools including P.S. 130 - Hernando De Soto, M.S. 131 Dr. Sun Yat Sen, and Clinton School.
Ownership History
Date
Name
Owned For
Owner Type
Purchase Details
Closed on
Mar 11, 2010
Sold by
Monogon Llc
Bought by
Watson Patrick
Current Estimated Value
Home Financials for this Owner
Home Financials are based on the most recent Mortgage that was taken out on this home.
Original Mortgage
$1,125,000
Outstanding Balance
$745,305
Interest Rate
5.05%
Mortgage Type
Purchase Money Mortgage
Estimated Equity
$2,405,109
Purchase Details
Closed on
Feb 14, 2007
Sold by
Coyne Kara and Coyne Paul
Bought by
Monogon Llc
Purchase Details
Closed on
Jan 4, 2005
Sold by
101 Maiden Lane Realty Co Llc and Arthur I
Bought by
Coyne Kara and Coyne Paul
Home Financials for this Owner
Home Financials are based on the most recent Mortgage that was taken out on this home.
Original Mortgage
$999,000
Interest Rate
5.71%
Mortgage Type
Purchase Money Mortgage
Create a Home Valuation Report for This Property
The Home Valuation Report is an in-depth analysis detailing your home's value as well as a comparison with similar homes in the area
Home Values in the Area
Average Home Value in this Area
Purchase History
| Date | Buyer | Sale Price | Title Company |
|---|---|---|---|
| Watson Patrick | $2,250,000 | -- | |
| Watson Patrick | $2,250,000 | -- | |
| Monogon Llc | $1,870,000 | -- | |
| Monogon Llc | $1,870,000 | -- | |
| Coyne Kara | $1,680,500 | -- | |
| Coyne Kara | $1,680,500 | -- |
Source: Public Records
Mortgage History
| Date | Status | Borrower | Loan Amount |
|---|---|---|---|
| Open | Watson Patrick | $1,125,000 | |
| Closed | Watson Patrick | $1,125,000 | |
| Previous Owner | Coyne Kara | $486,000 | |
| Previous Owner | Coyne Kara | $999,000 |
Source: Public Records
Tax History Compared to Growth
Tax History
| Year | Tax Paid | Tax Assessment Tax Assessment Total Assessment is a certain percentage of the fair market value that is determined by local assessors to be the total taxable value of land and additions on the property. | Land | Improvement |
|---|---|---|---|---|
| 2025 | $34,071 | $279,192 | $19,595 | $259,597 |
| 2024 | $34,071 | $272,527 | $19,595 | $252,932 |
| 2023 | $27,106 | $267,835 | $19,595 | $248,240 |
| 2022 | $26,124 | $263,941 | $19,595 | $244,346 |
| 2021 | $30,819 | $263,952 | $19,595 | $244,357 |
| 2020 | $31,128 | $292,515 | $19,595 | $272,920 |
| 2019 | $24,207 | $277,123 | $19,595 | $257,528 |
| 2018 | $28,806 | $267,442 | $19,595 | $247,847 |
| 2017 | $27,955 | $248,705 | $19,596 | $229,109 |
| 2016 | $25,542 | $247,015 | $19,595 | $227,420 |
| 2015 | $14,145 | $213,652 | $19,595 | $194,057 |
| 2014 | $14,145 | $215,429 | $19,596 | $195,833 |
Source: Public Records
Map
Nearby Homes
- 141 Grand St
- 240 Centre St Unit 2K
- 240 Centre St Unit 3J
- 240 Centre St Unit 3-B
- 185 Grand St Unit 6 C
- 185 Grand St Unit 2B
- 133 Mulberry St Unit 4C
- 133 Mulberry St Unit 2A
- 129 Lafayette St Unit 8C
- 30 Crosby St Unit 4B
- 30 Crosby St Unit 4A
- 123 Baxter St Unit 4A
- 274 Canal St
- 210 Lafayette St Unit 7D
- 210 Lafayette St Unit 2E
- 210 Lafayette St Unit 5B
- 210 Lafayette St Unit 4B
- 210 Lafayette St Unit 3A
- 48 Mercer St Unit 6
- 46 Mercer St Unit 4-W
- 161 Grand St
- 161 Grand St
- 161 Grand St Unit 9B
- 161 Grand St Unit 9A
- 161 Grand St Unit 8B
- 161 Grand St Unit 8A
- 161 Grand St Unit 7B
- 161 Grand St Unit 7A
- 161 Grand St Unit 6B
- 161 Grand St Unit 6A
- 161 Grand St Unit 5B
- 161 Grand St Unit 5A
- 161 Grand St Unit 4B
- 161 Grand St Unit 4A
- 161 Grand St Unit 3B
- 161 Grand St Unit 3A
- 161 Grand St Unit 2B
- 161 Grand St Unit PHA
- 161 Grand St Unit B
- 161 Grand St Unit A