Estimated Value: $529,102 - $588,000
4
Beds
1
Bath
1,734
Sq Ft
$318/Sq Ft
Est. Value
About This Home
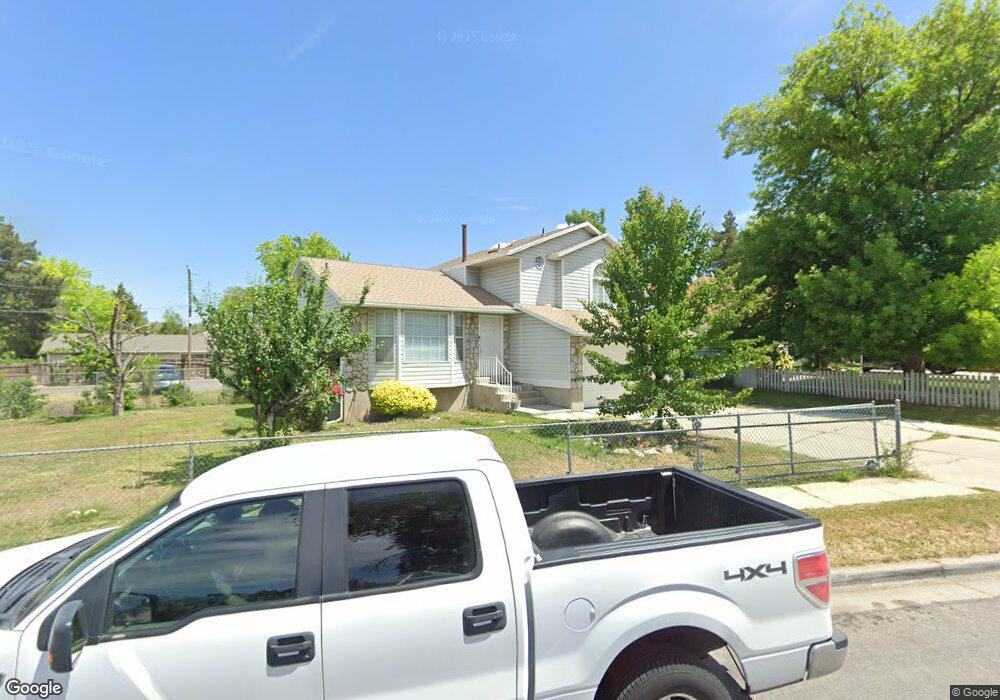
This home is located at 161 Handcart Way, Sandy, UT 84070 and is currently estimated at $550,776, approximately $317 per square foot. 161 Handcart Way is a home located in Salt Lake County with nearby schools including Midvalley Elementary School, Union Middle School, and Hillcrest High School.
Ownership History
Date
Name
Owned For
Owner Type
Purchase Details
Closed on
Jul 21, 2000
Sold by
Krzyzewski Mark S and Krzyzewski Lana J
Bought by
Sornvixay Souane and Saengsoury Bouasay
Current Estimated Value
Home Financials for this Owner
Home Financials are based on the most recent Mortgage that was taken out on this home.
Original Mortgage
$149,591
Outstanding Balance
$53,415
Interest Rate
8.2%
Mortgage Type
FHA
Estimated Equity
$497,361
Purchase Details
Closed on
Sep 25, 1997
Sold by
Chang Kai Tsun and Tsai Li Mei
Bought by
Krzyzewski Mark S and Krzyzewski Lana J
Home Financials for this Owner
Home Financials are based on the most recent Mortgage that was taken out on this home.
Original Mortgage
$123,773
Interest Rate
7.54%
Mortgage Type
FHA
Purchase Details
Closed on
Sep 6, 1995
Sold by
Chang Kai Tsun
Bought by
Chang Kai Tsun and Tsai Li Mei
Home Financials for this Owner
Home Financials are based on the most recent Mortgage that was taken out on this home.
Original Mortgage
$99,900
Interest Rate
7.83%
Create a Home Valuation Report for This Property
The Home Valuation Report is an in-depth analysis detailing your home's value as well as a comparison with similar homes in the area
Home Values in the Area
Average Home Value in this Area
Purchase History
| Date | Buyer | Sale Price | Title Company |
|---|---|---|---|
| Sornvixay Souane | -- | Backman Stewart Title Servic | |
| Krzyzewski Mark S | -- | -- | |
| Chang Kai Tsun | -- | -- | |
| Chang Kai Tsun | -- | -- |
Source: Public Records
Mortgage History
| Date | Status | Borrower | Loan Amount |
|---|---|---|---|
| Open | Sornvixay Souane | $149,591 | |
| Previous Owner | Krzyzewski Mark S | $123,773 | |
| Previous Owner | Chang Kai Tsun | $99,900 |
Source: Public Records
Tax History
| Year | Tax Paid | Tax Assessment Tax Assessment Total Assessment is a certain percentage of the fair market value that is determined by local assessors to be the total taxable value of land and additions on the property. | Land | Improvement |
|---|---|---|---|---|
| 2025 | $2,530 | $477,100 | $126,000 | $351,100 |
| 2024 | $2,530 | $467,400 | $118,500 | $348,900 |
| 2023 | $2,298 | $423,300 | $112,600 | $310,700 |
| 2022 | $2,397 | $431,800 | $110,400 | $321,400 |
| 2021 | $2,149 | $329,600 | $96,000 | $233,600 |
| 2020 | $2,039 | $294,800 | $77,800 | $217,000 |
| 2019 | $1,985 | $279,700 | $77,800 | $201,900 |
| 2016 | $1,757 | $238,000 | $69,100 | $168,900 |
Source: Public Records
Map
Nearby Homes
- 139 E Abbeville Ct
- 132 E Chambord Ct
- 144 E Chambord Ct
- 140 E Chambord Ct
- 138 E Chambord Ct
- 136 E Chambord Ct
- 8264 S Resaca Dr Unit K9
- 117 E Calbourne Ln Unit I4
- 227 E St Germain Way
- 8470 Solar Way
- 149 E Pioneer Ave
- 90 E Resaca Dr Unit C11
- 116 E Resaca Dr Unit F2
- 8229 S Resaca Dr Unit D3
- 194 Pioneer Ave
- 220 E Pioneer Ave
- 8459 S 300 E
- 359 E 8400 S
- 59 W Princeton Dr
- 274 E Water Mill Way Unit 230
- 8387 S 100 E
- 169 Handcart Way
- 8387 S 150 E
- 162 E Handcart Way
- 162 Handcart Way
- 160 E 8375 S
- 164 E 8375 S
- 177 E Handcart Way
- 177 Handcart Way
- 180 E 8375 S
- 153 E Rochefort Ct
- 153 E Rochefort Ct Unit 26
- 172 Handcart Way
- 172 E Handcart Way
- 150 E Lavalle Ct
- 185 Handcart Way
- 185 E Handcart Way
- 147 E Rochefort Ct
- 147 E Rochefort Ct Unit 25
- 151 E Lavalle Ct
Your Personal Tour Guide
Ask me questions while you tour the home.