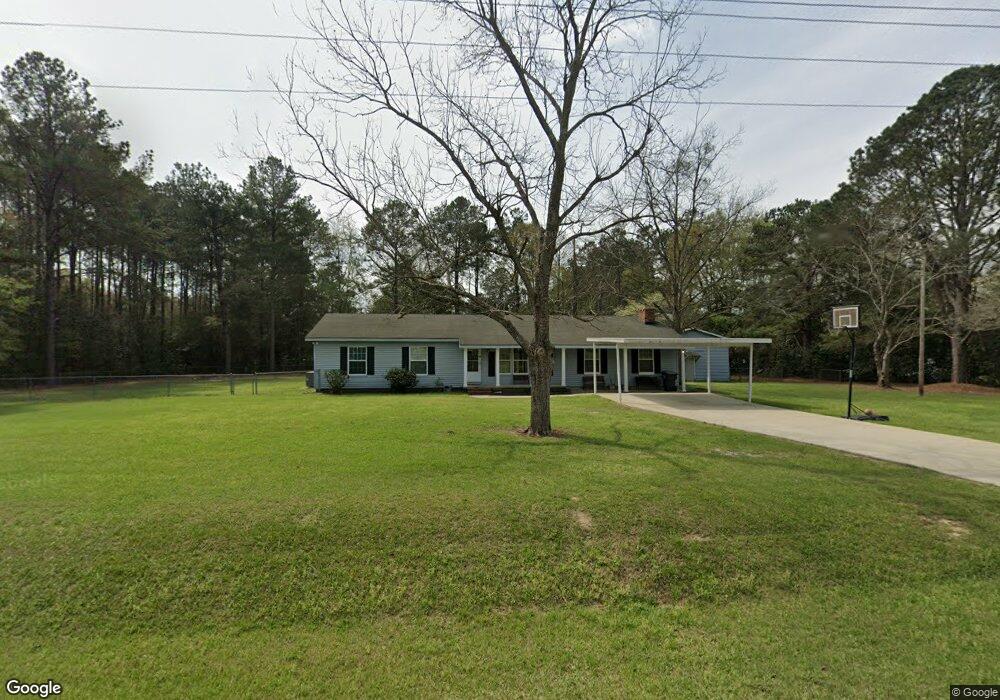
161 Hannah Branch Rd Cordele, GA 31015
Estimated Value: $239,653 - $321,000
3
Beds
1
Bath
1,972
Sq Ft
$145/Sq Ft
Est. Value
About This Home
This home is located at 161 Hannah Branch Rd, Cordele, GA 31015 and is currently estimated at $285,413, approximately $144 per square foot. 161 Hannah Branch Rd is a home located in Crisp County with nearby schools including Crisp County Elementary School, Crisp County Primary School, and Crisp County Middle School.
Ownership History
Date
Name
Owned For
Owner Type
Purchase Details
Closed on
Nov 11, 2015
Sold by
Wilkerson Albert C
Bought by
Wilkerson Kenneth D and Wilkerson Carrie
Current Estimated Value
Home Financials for this Owner
Home Financials are based on the most recent Mortgage that was taken out on this home.
Original Mortgage
$105,061
Outstanding Balance
$84,574
Interest Rate
4.5%
Mortgage Type
FHA
Estimated Equity
$200,839
Purchase Details
Closed on
Feb 22, 2013
Sold by
Lee Robert E
Bought by
Wilkerson Albert C and Wilkerson Cathy L
Purchase Details
Closed on
Apr 29, 1996
Sold by
Crane Sam C
Bought by
Lee Robert and Lee Alleene
Purchase Details
Closed on
Dec 10, 1993
Sold by
Crane Billie and Crane Sam
Bought by
Crane Sam C
Purchase Details
Closed on
Sep 18, 1992
Sold by
Crane Sam
Bought by
Central Savings Bank
Purchase Details
Closed on
Feb 11, 1989
Sold by
Crane Billie R
Bought by
Crane Sam C
Purchase Details
Closed on
Apr 3, 1985
Bought by
Crane Billie and Crane Sam
Create a Home Valuation Report for This Property
The Home Valuation Report is an in-depth analysis detailing your home's value as well as a comparison with similar homes in the area
Home Values in the Area
Average Home Value in this Area
Purchase History
| Date | Buyer | Sale Price | Title Company |
|---|---|---|---|
| Wilkerson Kenneth D | $107,000 | -- | |
| Wilkerson Albert C | $81,000 | -- | |
| Lee Robert | $81,000 | -- | |
| Crane Sam C | -- | -- | |
| Central Savings Bank | -- | -- | |
| Crane Sam C | -- | -- | |
| Crane Billie | -- | -- |
Source: Public Records
Mortgage History
| Date | Status | Borrower | Loan Amount |
|---|---|---|---|
| Open | Wilkerson Kenneth D | $105,061 | |
| Closed | Wilkerson Albert C | $0 |
Source: Public Records
Tax History Compared to Growth
Tax History
| Year | Tax Paid | Tax Assessment Tax Assessment Total Assessment is a certain percentage of the fair market value that is determined by local assessors to be the total taxable value of land and additions on the property. | Land | Improvement |
|---|---|---|---|---|
| 2024 | $1,877 | $69,326 | $6,182 | $63,144 |
| 2023 | $1,732 | $61,656 | $6,182 | $55,474 |
| 2022 | $1,647 | $58,640 | $6,182 | $52,458 |
| 2021 | $1,477 | $49,824 | $6,182 | $43,642 |
| 2020 | $1,480 | $49,824 | $6,182 | $43,642 |
| 2019 | $1,470 | $49,824 | $6,182 | $43,642 |
| 2018 | $1,304 | $42,584 | $5,410 | $37,174 |
| 2017 | $1,310 | $42,584 | $5,410 | $37,174 |
| 2016 | $1,308 | $42,584 | $5,410 | $37,174 |
| 2015 | -- | $42,584 | $5,410 | $37,174 |
| 2014 | -- | $42,584 | $5,410 | $37,174 |
| 2013 | -- | $42,584 | $5,409 | $37,174 |
Source: Public Records
Map
Nearby Homes
- 199 Hurt Dr
- 620 Lakeshore Dr
- 120 Cove Rd
- 0 Swift Creek Rd Unit 138425
- 118 Swift Creek Rd
- 484 Lakeshore Way
- 484 Spring Creek Rd
- 636 Spring Creek Rd
- 480 Spring Creek Rd
- 144 Bryant Rd
- 198 Swift Creek Rd
- 0 Arabi Warwick Rd
- 102 Perch Dr
- 000 Bream Rd
- 1022 Flournoy Rd
- 888 Flournoy Rd
- Lot 15 Georgia-Florida Pkwy
- 000 Lakeshore Way
- 0 Power Dam Rd
- 130 Swift Creek Rd
- 169 Hannah Branch Rd
- 148 Smoak Rd
- 174 Smoak Rd
- 152 Hannah Branch Rd
- 166 Hannah Branch Rd
- 174 Hannah Branch Rd
- 145 Hannah Branch Rd
- 839 Lakeshore Dr
- 837 Lakeshore Dr
- 775 Lakeshore Dr
- 843 Lakeshore Dr
- 769 Lakeshore Dr
- 779 Lakeshore Dr
- 785 Lakeshore Dr
- 833 Lakeshore Dr
- 0 Hannah Branch Rd
- TBD Hannah Branch Rd
- 791 Lakeshore Dr
- 140 Hannah Branch Rd
- 124 Smoak Rd