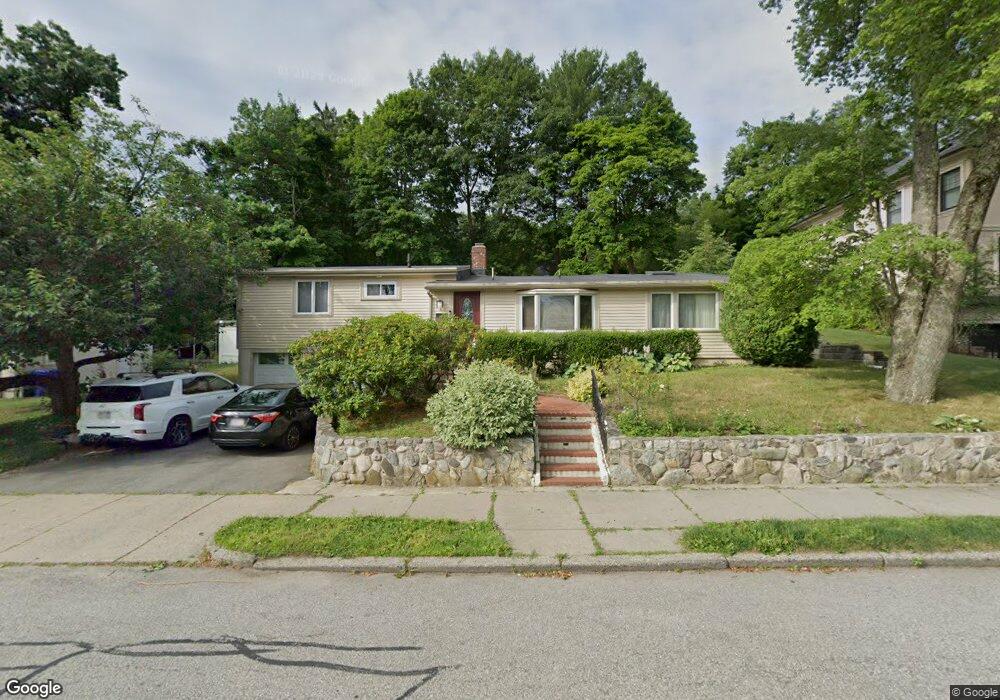
161 Hartman Rd Newton Center, MA 02459
Oak Hill NeighborhoodEstimated Value: $1,298,549 - $1,549,000
3
Beds
3
Baths
1,704
Sq Ft
$811/Sq Ft
Est. Value
About This Home
This home is located at 161 Hartman Rd, Newton Center, MA 02459 and is currently estimated at $1,382,137, approximately $811 per square foot. 161 Hartman Rd is a home located in Middlesex County with nearby schools including Memorial Spaulding Elementary School, Oak Hill Middle School, and Newton South High School.
Ownership History
Date
Name
Owned For
Owner Type
Purchase Details
Closed on
Jul 12, 2012
Sold by
Mirchevsky Greg
Bought by
Mirchevsky Greg and Mirchevsky Dasha
Current Estimated Value
Home Financials for this Owner
Home Financials are based on the most recent Mortgage that was taken out on this home.
Original Mortgage
$403,000
Outstanding Balance
$279,368
Interest Rate
3.76%
Mortgage Type
New Conventional
Estimated Equity
$1,102,769
Purchase Details
Closed on
Oct 30, 2006
Sold by
Mirchevsky Anna Y and Mirchevsky Greg
Bought by
Mirchevsky Greg
Purchase Details
Closed on
Aug 25, 2005
Sold by
Kunakhovich Nataliya and Ginzburg Natasha
Bought by
Mirchevsky Anna Y and Mirchevsky Greg
Purchase Details
Closed on
Jul 31, 1995
Sold by
Maftoon Javad and Darabi Golnoosh
Bought by
Aliyev Viktor and Kunakhivich Nataliya
Create a Home Valuation Report for This Property
The Home Valuation Report is an in-depth analysis detailing your home's value as well as a comparison with similar homes in the area
Home Values in the Area
Average Home Value in this Area
Purchase History
| Date | Buyer | Sale Price | Title Company |
|---|---|---|---|
| Mirchevsky Greg | -- | -- | |
| Mirchevsky Greg | -- | -- | |
| Mirchevsky Anna Y | $655,000 | -- | |
| Aliyev Viktor | $280,000 | -- |
Source: Public Records
Mortgage History
| Date | Status | Borrower | Loan Amount |
|---|---|---|---|
| Open | Mirchevsky Greg | $403,000 | |
| Previous Owner | Aliyev Viktor | $412,400 | |
| Previous Owner | Aliyev Viktor | $222,000 | |
| Previous Owner | Aliyev Viktor | $414,000 |
Source: Public Records
Tax History Compared to Growth
Tax History
| Year | Tax Paid | Tax Assessment Tax Assessment Total Assessment is a certain percentage of the fair market value that is determined by local assessors to be the total taxable value of land and additions on the property. | Land | Improvement |
|---|---|---|---|---|
| 2025 | $9,859 | $1,006,000 | $0 | $0 |
| 2024 | $9,492 | $0 | $0 | $0 |
| 2023 | $8,911 | $875,300 | $826,100 | $49,200 |
| 2022 | $8,526 | $810,500 | $764,900 | $45,600 |
| 2021 | $8,227 | $764,600 | $721,600 | $43,000 |
| 2020 | $7,982 | $764,600 | $721,600 | $43,000 |
| 2019 | $7,757 | $742,300 | $700,600 | $41,700 |
| 2018 | $7,392 | $683,200 | $638,000 | $45,200 |
| 2017 | $7,167 | $644,500 | $601,900 | $42,600 |
| 2016 | $6,854 | $602,300 | $562,500 | $39,800 |
| 2015 | $6,535 | $562,900 | $525,700 | $37,200 |
Source: Public Records
Map
Nearby Homes
- 135 Hartman Rd
- 41 Juniper Ln
- 59 Deborah Rd
- 63 Drumlin Rd
- 44 Lovett Rd
- 56 Cynthia Rd
- 99 Baldpate Hill Rd
- 65 Levbert Rd
- 21 Lovett Rd
- 36 Ober Rd
- 58 Country Club Rd
- 853 Dedham St
- 133 Oak Hill St
- 70 Pond Brook Rd
- 45 Brandeis Rd
- 14 Rolling Ln
- 109 Harwich Rd
- 415 Dedham St Unit D
- 136 Dudley Rd
- 22 Nightingale Path
- 155 Hartman Rd
- 155 Hartman Rd
- 155 Hartman Rd Unit 2
- 31 Cottonwood Rd
- 169 Hartman Rd
- 15 Cottonwood Rd
- 147 Hartman Rd
- 164 Hartman Rd
- 156 Hartman Rd
- 170 Hartman Rd
- 39 Cottonwood Rd
- 150 Hartman Rd
- 8 Cottonwood Rd
- 141 Hartman Rd
- 141 Hartman Rd
- 176 Hartman Rd
- 6 Cottonwood Rd
- 8 Cottonwood Rd
- 26 Cottonwood Rd
- 142 Hartman Rd