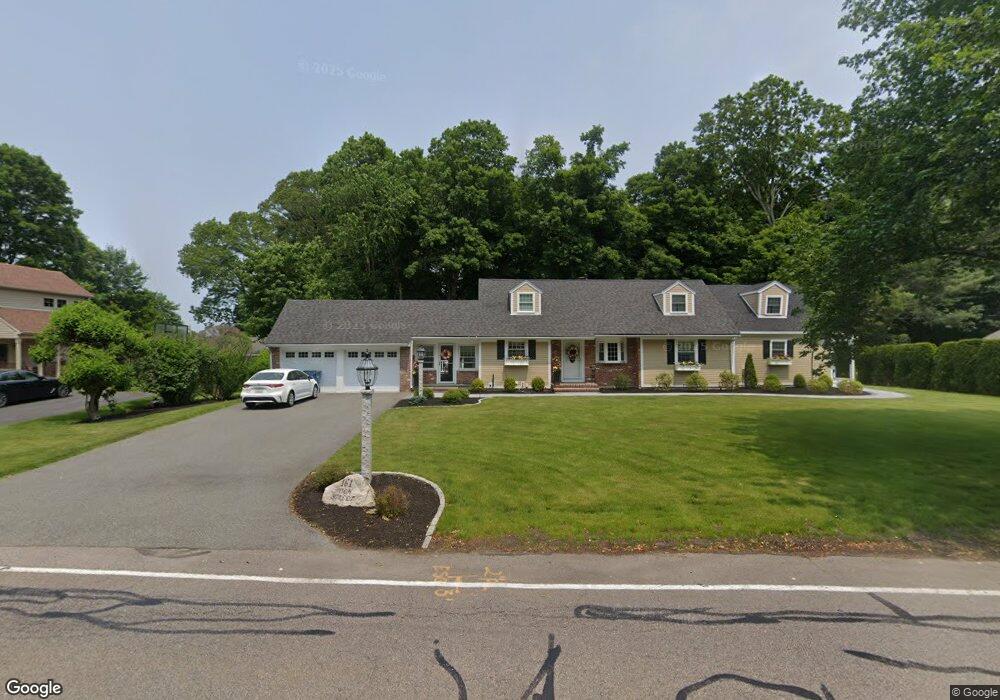
161 High St Canton, MA 02021
Estimated Value: $910,000 - $1,148,000
4
Beds
5
Baths
2,715
Sq Ft
$385/Sq Ft
Est. Value
About This Home
This home is located at 161 High St, Canton, MA 02021 and is currently estimated at $1,046,154, approximately $385 per square foot. 161 High St is a home located in Norfolk County with nearby schools including Canton High School, St. John the Evangelist School, and Chabad Day School of School.
Ownership History
Date
Name
Owned For
Owner Type
Purchase Details
Closed on
May 22, 2000
Sold by
Difelice Ft
Bought by
Defelice Joanna R
Current Estimated Value
Home Financials for this Owner
Home Financials are based on the most recent Mortgage that was taken out on this home.
Original Mortgage
$100,000
Outstanding Balance
$34,671
Interest Rate
8.19%
Mortgage Type
Purchase Money Mortgage
Estimated Equity
$1,011,483
Create a Home Valuation Report for This Property
The Home Valuation Report is an in-depth analysis detailing your home's value as well as a comparison with similar homes in the area
Home Values in the Area
Average Home Value in this Area
Purchase History
| Date | Buyer | Sale Price | Title Company |
|---|---|---|---|
| Defelice Joanna R | $125,000 | -- |
Source: Public Records
Mortgage History
| Date | Status | Borrower | Loan Amount |
|---|---|---|---|
| Open | Defelice Joanna R | $100,000 | |
| Previous Owner | Defelice Joanna R | $36,000 |
Source: Public Records
Tax History
| Year | Tax Paid | Tax Assessment Tax Assessment Total Assessment is a certain percentage of the fair market value that is determined by local assessors to be the total taxable value of land and additions on the property. | Land | Improvement |
|---|---|---|---|---|
| 2025 | $9,747 | $985,500 | $299,400 | $686,100 |
| 2024 | $5,559 | $557,600 | $288,000 | $269,600 |
| 2023 | $5,466 | $517,100 | $288,000 | $229,100 |
| 2022 | $5,305 | $467,400 | $274,200 | $193,200 |
| 2021 | $5,170 | $423,800 | $249,300 | $174,500 |
| 2020 | $5,016 | $410,100 | $237,400 | $172,700 |
| 2019 | $4,873 | $393,000 | $215,800 | $177,200 |
| 2018 | $4,735 | $381,200 | $207,500 | $173,700 |
| 2017 | $4,823 | $377,100 | $203,500 | $173,600 |
| 2016 | $4,746 | $371,100 | $198,500 | $172,600 |
| 2015 | $4,638 | $361,800 | $192,700 | $169,100 |
Source: Public Records
Map
Nearby Homes
- 265 Norfolk St
- 353 Washington St
- 69 Pond St
- 84 Walpole St Unit 1C
- 77 Neponset St Unit 77
- 59 Walpole St Unit 116
- 59 Walpole St Unit 210
- 1 Revolution Way Unit 208
- 1 Revolution Way Unit 307
- 356 Neponset St Unit E
- 360 Neponset St Unit 702
- 651 Washington St
- 30 Coppersmith Way Unit 209
- 30 Coppersmith Way Unit 313
- 30 Coppersmith Way Unit 112
- 30 Coppersmith Way Unit 207
- 30 Coppersmith Way Unit 109
- 30 Coppersmith Way Unit 206
- 30 Coppersmith Way Unit 110
- 30 Coppersmith Way Unit 113
Your Personal Tour Guide
Ask me questions while you tour the home.