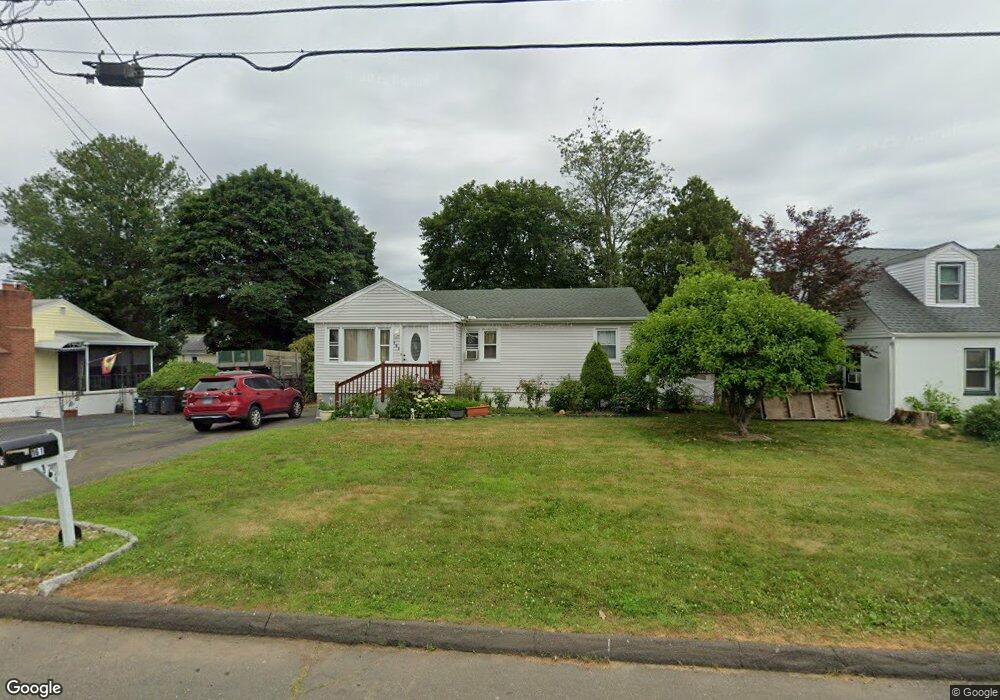
161 Highland Ave East Haven, CT 06513
Estimated Value: $328,621 - $386,000
2
Beds
1
Bath
976
Sq Ft
$363/Sq Ft
Est. Value
About This Home
This home is located at 161 Highland Ave, East Haven, CT 06513 and is currently estimated at $354,655, approximately $363 per square foot. 161 Highland Ave is a home located in New Haven County with nearby schools including Deer Run School, East Haven High School, and All Nations Christian Academy.
Ownership History
Date
Name
Owned For
Owner Type
Purchase Details
Closed on
Jun 24, 2021
Sold by
Lucero Silverio
Bought by
Lucero Silverio and Mendez Ortencia G
Current Estimated Value
Home Financials for this Owner
Home Financials are based on the most recent Mortgage that was taken out on this home.
Original Mortgage
$151,500
Outstanding Balance
$113,517
Interest Rate
2.2%
Mortgage Type
Stand Alone Refi Refinance Of Original Loan
Estimated Equity
$241,138
Purchase Details
Closed on
Jul 31, 2006
Sold by
Appleby Brian J and Mcknight Kimberly A
Bought by
Lucero Silverio
Home Financials for this Owner
Home Financials are based on the most recent Mortgage that was taken out on this home.
Original Mortgage
$202,825
Interest Rate
6.67%
Purchase Details
Closed on
Mar 24, 2004
Sold by
Lillo Mary L
Bought by
Mcknight Kimberly A and Applehy Brian J
Create a Home Valuation Report for This Property
The Home Valuation Report is an in-depth analysis detailing your home's value as well as a comparison with similar homes in the area
Home Values in the Area
Average Home Value in this Area
Purchase History
| Date | Buyer | Sale Price | Title Company |
|---|---|---|---|
| Lucero Silverio | -- | None Available | |
| Lucero Silverio | -- | None Available | |
| Lucero Silverio | $213,500 | -- | |
| Mcknight Kimberly A | $156,000 | -- | |
| Lucero Silverio | $213,500 | -- | |
| Mcknight Kimberly A | $156,000 | -- |
Source: Public Records
Mortgage History
| Date | Status | Borrower | Loan Amount |
|---|---|---|---|
| Open | Lucero Silverio | $151,500 | |
| Previous Owner | Mcknight Kimberly A | $201,000 | |
| Previous Owner | Mcknight Kimberly A | $202,825 | |
| Previous Owner | Mcknight Kimberly A | $189,000 |
Source: Public Records
Tax History Compared to Growth
Tax History
| Year | Tax Paid | Tax Assessment Tax Assessment Total Assessment is a certain percentage of the fair market value that is determined by local assessors to be the total taxable value of land and additions on the property. | Land | Improvement |
|---|---|---|---|---|
| 2025 | $4,745 | $141,890 | $42,000 | $99,890 |
| 2024 | $4,745 | $141,890 | $42,000 | $99,890 |
| 2023 | $4,427 | $141,890 | $42,000 | $99,890 |
| 2022 | $4,427 | $141,890 | $42,000 | $99,890 |
| 2021 | $3,735 | $109,040 | $35,010 | $74,030 |
| 2020 | $3,735 | $109,040 | $35,010 | $74,030 |
| 2019 | $3,535 | $109,040 | $35,010 | $74,030 |
| 2018 | $3,538 | $109,040 | $35,010 | $74,030 |
| 2017 | $3,440 | $109,040 | $35,010 | $74,030 |
| 2016 | $3,443 | $109,140 | $38,510 | $70,630 |
| 2015 | $3,443 | $109,140 | $38,510 | $70,630 |
| 2014 | $3,436 | $107,210 | $36,580 | $70,630 |
Source: Public Records
Map
Nearby Homes
- 90 Foxon Blvd
- 300 Foxon Hill Rd
- 1445 Quinnipiac Ave
- 30 Thompson St
- 24 Laura Cir
- 8 Birch Ln Unit A
- 81 Melrose Dr
- 15 Cedar Ct Unit G
- 9 Birch Ln Unit K
- 75 Redwood Dr Unit 609
- 15 Glen Haven Rd
- 52 Glen Haven Rd
- 1706 Quinnipiac Ave
- 1423 Quinnipiac Ave Unit 808
- 1423 Quinnipiac Ave Unit 709
- 1423 Quinnipiac Ave Unit 108
- 1423 Quinnipiac Ave Unit 602
- 173 Russo Ave Unit 409
- 173 Russo Ave Unit 609
- 173 Russo Ave Unit 410
- 157 Highland Ave
- 167 Highland Ave
- 150 Crest Ave
- 153 Highland Ave
- 144 Crest Ave
- 171 Highland Ave
- 158 Crest Ave
- 160 Highland Ave
- 164 Highland Ave
- 154 Highland Ave
- 168 Highland Ave
- 148 Highland Ave
- 147 Highland Ave
- 134 Crest Ave
- 174 Highland Ave
- 144 Highland Ave
- 141 Crest Ave
- 177 Highland Ave
- 141 Highland Ave
- 199 Foxon Blvd