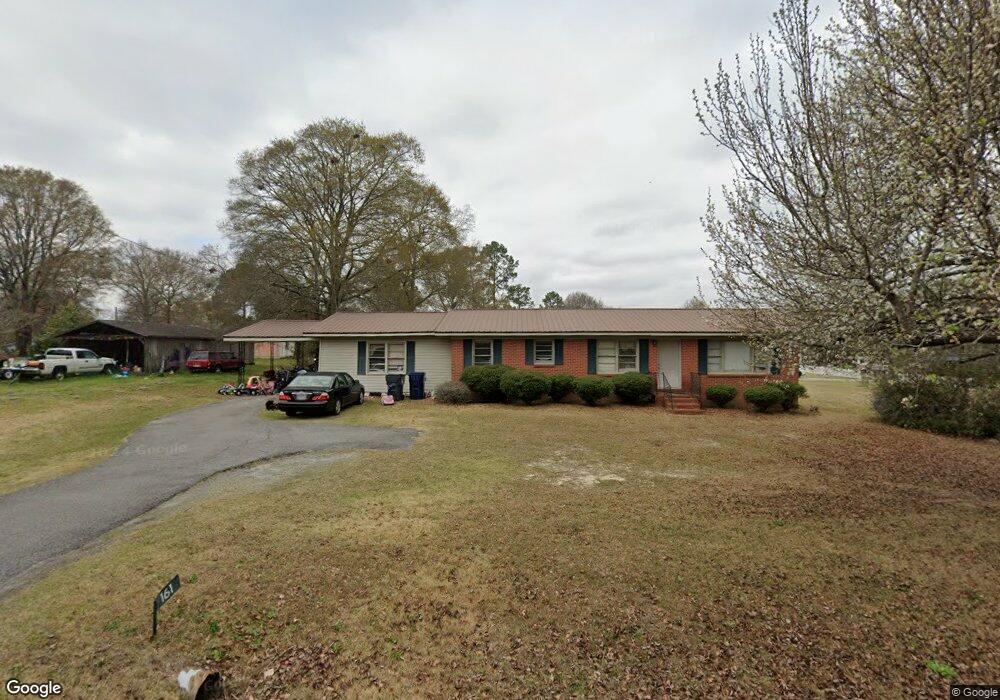
161 Larryton Drive Rd Cochran, GA 31014
Estimated Value: $147,000 - $192,000
3
Beds
2
Baths
1,728
Sq Ft
$97/Sq Ft
Est. Value
About This Home
This home is located at 161 Larryton Drive Rd, Cochran, GA 31014 and is currently estimated at $167,331, approximately $96 per square foot. 161 Larryton Drive Rd is a home located in Bleckley County with nearby schools including Bleckley County Primary School, Bleckley County Elementary School, and Bleckley Middle School.
Ownership History
Date
Name
Owned For
Owner Type
Purchase Details
Closed on
Apr 18, 2019
Sold by
Horne Dennis Gene
Bought by
Upperman Hannah and Upperman Jeremy R
Current Estimated Value
Home Financials for this Owner
Home Financials are based on the most recent Mortgage that was taken out on this home.
Original Mortgage
$83,361
Outstanding Balance
$71,309
Interest Rate
3.25%
Mortgage Type
FHA
Estimated Equity
$96,022
Purchase Details
Closed on
Apr 15, 2019
Sold by
Horne Betty W
Bought by
Horne Dennis Gene and Horne Phil Alan
Home Financials for this Owner
Home Financials are based on the most recent Mortgage that was taken out on this home.
Original Mortgage
$83,361
Outstanding Balance
$71,309
Interest Rate
3.25%
Mortgage Type
FHA
Estimated Equity
$96,022
Purchase Details
Closed on
Mar 31, 2011
Sold by
Horne Betty W
Bought by
Horne Dennis Gene and Horne Phil Alan
Purchase Details
Closed on
Aug 1, 1985
Sold by
Horne Gene F
Bought by
Horne Betty W
Purchase Details
Closed on
Oct 26, 1977
Bought by
Horne Gene F
Create a Home Valuation Report for This Property
The Home Valuation Report is an in-depth analysis detailing your home's value as well as a comparison with similar homes in the area
Home Values in the Area
Average Home Value in this Area
Purchase History
| Date | Buyer | Sale Price | Title Company |
|---|---|---|---|
| Upperman Hannah | $84,900 | -- | |
| Horne Dennis Gene | -- | -- | |
| Horne Dennis Gene | -- | -- | |
| Horne Betty W | -- | -- | |
| Horne Gene F | -- | -- |
Source: Public Records
Mortgage History
| Date | Status | Borrower | Loan Amount |
|---|---|---|---|
| Open | Upperman Hannah | $83,361 |
Source: Public Records
Tax History
| Year | Tax Paid | Tax Assessment Tax Assessment Total Assessment is a certain percentage of the fair market value that is determined by local assessors to be the total taxable value of land and additions on the property. | Land | Improvement |
|---|---|---|---|---|
| 2025 | $1,323 | $49,560 | $6,520 | $43,040 |
| 2024 | $1,213 | $45,360 | $2,320 | $43,040 |
| 2023 | $1,259 | $45,360 | $2,320 | $43,040 |
| 2022 | $1,092 | $40,120 | $2,320 | $37,800 |
| 2021 | $950 | $32,640 | $2,320 | $30,320 |
| 2020 | $950 | $32,640 | $2,320 | $30,320 |
| 2019 | $885 | $30,333 | $3,360 | $26,973 |
| 2018 | $892 | $30,333 | $3,360 | $26,973 |
| 2017 | $994 | $30,333 | $3,360 | $26,973 |
| 2016 | $892 | $30,333 | $3,360 | $26,973 |
| 2015 | -- | $30,333 | $3,360 | $26,973 |
| 2014 | -- | $30,333 | $3,360 | $26,973 |
| 2013 | -- | $30,333 | $3,360 | $26,973 |
Source: Public Records
Map
Nearby Homes
- 121 Bowman Dr
- 140 Rene Ln
- 0 Lucas Rd
- 167 1st Ave
- 129 N 7th St
- 161 E Cherry St
- 7 Evergreen Dr
- 113 Taylor Dr
- 0 Lake Linda Estates Unit 261702
- 492 Ga Highway 26 E
- 0 Tiffany Dr Unit 131
- 0 Tiffany Dr Unit 10664262
- 173 Berkley Rd
- 104 S 4th St
- 188 E Lewis St
- 264 Ann St
- 260 Ann St
- 1277 Georgia 112
- 168 Crest Dr
- 116 W Lewis St
- 161 Larryton Dr
- 112 Gayle Dr
- LL 130 Gayle Dr Unit 130
- 160 Larryton Drive Rd
- 164 Larryton Drive Rd
- 173 Malgene Dr
- 108 Gayle Dr
- 173 Malgene Drive Rd
- 109 Gayle Dr
- 181 Malgene Drive Rd
- 128 Gayle Dr
- 163 Malgene Drive Rd
- 163 Malgene Dr
- 164 Malgene Dr
- 159 Malgene Drive Rd
- 168 Malgene Drive Rd
- LL 132 Gayle Dr Unit 132
- 178 Rene Dr
- 143 Larryton Drive Rd
- 164 Malgene Drive Rd
Your Personal Tour Guide
Ask me questions while you tour the home.