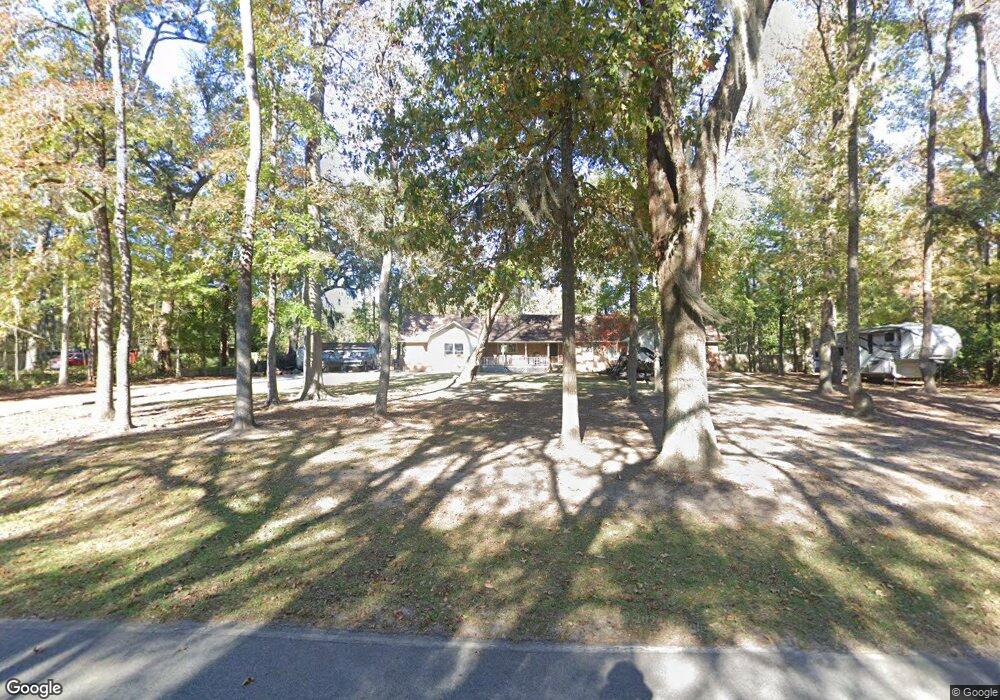
161 Magnolia Rd Midway, GA 31320
Estimated Value: $366,000 - $403,745
3
Beds
2
Baths
2,009
Sq Ft
$189/Sq Ft
Est. Value
About This Home
This home is located at 161 Magnolia Rd, Midway, GA 31320 and is currently estimated at $379,936, approximately $189 per square foot. 161 Magnolia Rd is a home located in Liberty County with nearby schools including Liberty Elementary School, Midway Middle School, and Liberty County High School.
Ownership History
Date
Name
Owned For
Owner Type
Purchase Details
Closed on
Jun 25, 2021
Sold by
Ragsdale Allison
Bought by
Jenkins Sharon D
Current Estimated Value
Home Financials for this Owner
Home Financials are based on the most recent Mortgage that was taken out on this home.
Original Mortgage
$248,425
Outstanding Balance
$225,407
Interest Rate
2.9%
Mortgage Type
New Conventional
Estimated Equity
$154,529
Purchase Details
Closed on
Apr 2, 2019
Sold by
Slagle Jonathan
Bought by
Ragsdale Allison
Purchase Details
Closed on
Jun 1, 2018
Sold by
Wiley Jerry Darlene
Bought by
Wiley Michael Craig
Home Financials for this Owner
Home Financials are based on the most recent Mortgage that was taken out on this home.
Original Mortgage
$203,700
Interest Rate
4.5%
Mortgage Type
New Conventional
Purchase Details
Closed on
Feb 12, 2010
Sold by
Wiley Bobby Lee
Bought by
Wiley Jerry Darlene
Create a Home Valuation Report for This Property
The Home Valuation Report is an in-depth analysis detailing your home's value as well as a comparison with similar homes in the area
Home Values in the Area
Average Home Value in this Area
Purchase History
| Date | Buyer | Sale Price | Title Company |
|---|---|---|---|
| Jenkins Sharon D | $261,500 | -- | |
| Ragsdale Allison | -- | -- | |
| Wiley Michael Craig | $210 | -- | |
| Ragsdale Allison | $210,000 | -- | |
| Wiley Jerry Darlene | -- | -- |
Source: Public Records
Mortgage History
| Date | Status | Borrower | Loan Amount |
|---|---|---|---|
| Open | Jenkins Sharon D | $248,425 | |
| Previous Owner | Ragsdale Allison | $203,700 |
Source: Public Records
Tax History Compared to Growth
Tax History
| Year | Tax Paid | Tax Assessment Tax Assessment Total Assessment is a certain percentage of the fair market value that is determined by local assessors to be the total taxable value of land and additions on the property. | Land | Improvement |
|---|---|---|---|---|
| 2024 | $4,867 | $128,074 | $22,898 | $105,176 |
| 2023 | $4,867 | $115,269 | $22,898 | $92,371 |
| 2022 | $3,969 | $98,588 | $22,898 | $75,690 |
| 2021 | $2,943 | $72,222 | $16,055 | $56,167 |
| 2020 | $2,945 | $72,237 | $16,055 | $56,182 |
| 2019 | $2,901 | $72,997 | $16,055 | $56,942 |
| 2018 | $1,520 | $73,011 | $16,055 | $56,956 |
| 2017 | $2,429 | $73,772 | $16,055 | $57,717 |
| 2016 | $1,335 | $73,787 | $16,055 | $57,732 |
| 2015 | $1,321 | $67,259 | $19,101 | $48,158 |
| 2014 | $1,321 | $72,452 | $26,170 | $46,282 |
| 2013 | -- | $69,220 | $26,169 | $43,051 |
Source: Public Records
Map
Nearby Homes
- 4 Rd
- 259 Island Dr
- 181 Pineland Rd
- 0 Magnolia Rd
- 4 Magnolia Rd
- 321 Carlyene Dr
- 525 Carlyene Dr
- 545 Carlyene Dr
- 260 W 1st St
- 170 Circle Rd
- 120 Pinetree Rd
- 35/36 W 1st St Unit 35/36
- 514 W 1st St
- 777 E 1st St
- 0 Pinetree Rd Unit SA340350
- 715 E 1st St
- 10 Pinetree Rd
- 3194 Isle of Wight Rd
- 3182 Isle of Wight Rd
- 127 Clark St