161 Maple St Bellingham, MA 02019
Estimated Value: $488,667 - $589,000
About This Home
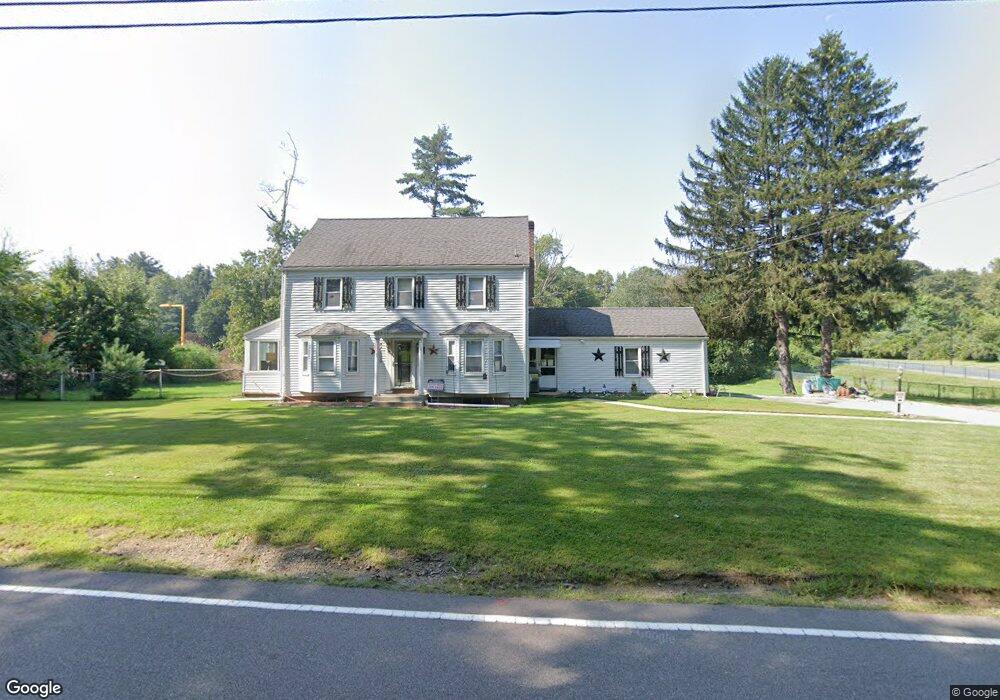
This home is located at 161 Maple St, Bellingham, MA 02019 and is currently estimated at $523,667, approximately $336 per square foot. 161 Maple St is a home located in Norfolk County with nearby schools including Stall Brook Elementary School, Bellingham High School, and Bethany Christian Academy.
Ownership History
We collect this data history from publicly available records. To have your information removed, we recommend requesting removal directly through your county’s website.
Purchase Details
Purchase Details
Home Financials for this Owner
Home Financials are based on the most recent Mortgage that was taken out on this home.Home Values in the Area
Average Home Value in this Area
Purchase History
We collect this data history from publicly available records. To have your information removed, we recommend requesting removal directly through your county’s website.
| Date | Buyer | Sale Price | Title Company |
|---|---|---|---|
| $288,673 | -- | ||
| $290,000 | -- | ||
| $290,000 | -- |
Mortgage History
We collect this data history from publicly available records. To have your information removed, we recommend requesting removal directly through your county’s website.
| Date | Status | Borrower | Loan Amount |
|---|---|---|---|
| Previous Owner | $260,000 | ||
| Previous Owner | $75,000 | ||
| Closed | $0 |
Tax History
We collect this data history from publicly available records. To have your information removed, we recommend requesting removal directly through your county’s website.
| Year | Tax Paid | Tax Assessment Tax Assessment Total Assessment is a certain percentage of the fair market value that is determined by local assessors to be the total taxable value of land and additions on the property. | Land | Improvement |
|---|---|---|---|---|
| 2025 | $4,746 | $377,900 | $137,800 | $240,100 |
| 2024 | $4,561 | $354,700 | $125,900 | $228,800 |
| 2023 | $4,395 | $336,800 | $119,800 | $217,000 |
| 2022 | $4,327 | $307,300 | $100,200 | $207,100 |
| 2021 | $4,180 | $290,100 | $100,200 | $189,900 |
| 2020 | $3,935 | $276,700 | $100,200 | $176,500 |
| 2019 | $3,854 | $271,200 | $100,200 | $171,000 |
| 2018 | $3,660 | $254,000 | $101,100 | $152,900 |
| 2017 | $3,585 | $250,000 | $101,100 | $148,900 |
| 2016 | $3,471 | $242,900 | $105,100 | $137,800 |
| 2015 | $3,329 | $233,600 | $101,100 | $132,500 |
| 2014 | $3,326 | $226,900 | $97,600 | $129,300 |
Map
- 9 Catherine Ave
- 3 Thomas Dr
- 359 Hartford Ave
- 85 Pine St
- 472 Coronation Dr
- 354 Maple St
- 453 Hartford Ave
- 121 Twin Brook Ln
- 8 Walker Rd
- 455 Hartford Ave
- 65 Brookview Rd Unit 65
- 7 Tropeano Ct Unit 7
- 0 Hixon St Unit 73477486
- 834-836 W Central St
- 45 Baron Rd
- 64 Monique Dr
- 95 Lisa Ann Dr
- 2 Downingwood Dr
- 42 Bruce Rd
- 44 Granite St
Ask me questions while you tour the home.