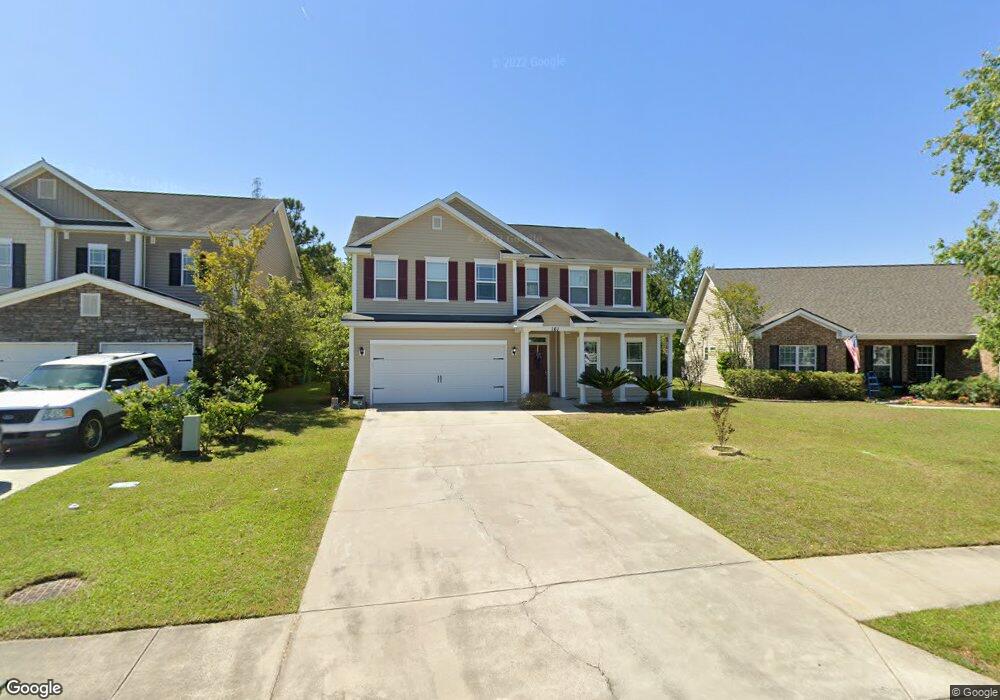
161 Pine View Crossing Pooler, GA 31322
Estimated Value: $375,718 - $433,000
4
Beds
3
Baths
2,548
Sq Ft
$156/Sq Ft
Est. Value
About This Home
This home is located at 161 Pine View Crossing, Pooler, GA 31322 and is currently estimated at $397,430, approximately $155 per square foot. 161 Pine View Crossing is a home located in Chatham County with nearby schools including West Chatham Elementary School, West Chatham Middle School, and New Hampstead High School.
Ownership History
Date
Name
Owned For
Owner Type
Purchase Details
Closed on
Sep 9, 2021
Sold by
Woodard Renard Gregory
Bought by
Woodard Angeleque Q
Current Estimated Value
Purchase Details
Closed on
Nov 29, 2011
Bought by
Woodard Renard Gregory
Home Financials for this Owner
Home Financials are based on the most recent Mortgage that was taken out on this home.
Original Mortgage
$165,387
Interest Rate
3.87%
Mortgage Type
FHA
Purchase Details
Closed on
Dec 27, 2010
Sold by
Harbin Matthew K
Bought by
Postreich Jeremy Nicholas and Postreich Sarah L
Purchase Details
Closed on
Jan 10, 2007
Sold by
Not Provided
Bought by
Sec Of Housing & Urban
Create a Home Valuation Report for This Property
The Home Valuation Report is an in-depth analysis detailing your home's value as well as a comparison with similar homes in the area
Home Values in the Area
Average Home Value in this Area
Purchase History
| Date | Buyer | Sale Price | Title Company |
|---|---|---|---|
| Woodard Angeleque Q | -- | -- | |
| Woodard Renard Gregory | $163,850 | -- | |
| Woodard Renard Gregory | $163,850 | -- | |
| Postreich Jeremy Nicholas | $215,500 | -- | |
| Sec Of Housing & Urban | $1,801,440 | -- |
Source: Public Records
Mortgage History
| Date | Status | Borrower | Loan Amount |
|---|---|---|---|
| Previous Owner | Woodard Renard Gregory | $165,387 |
Source: Public Records
Tax History
| Year | Tax Paid | Tax Assessment Tax Assessment Total Assessment is a certain percentage of the fair market value that is determined by local assessors to be the total taxable value of land and additions on the property. | Land | Improvement |
|---|---|---|---|---|
| 2025 | $4,908 | $135,480 | $24,000 | $111,480 |
| 2024 | $36 | $134,480 | $24,000 | $110,480 |
| 2023 | $3,640 | $114,000 | $12,160 | $101,840 |
| 2022 | $2,679 | $104,040 | $12,160 | $91,880 |
| 2021 | $2,695 | $90,360 | $12,160 | $78,200 |
| 2020 | $2,563 | $87,960 | $12,160 | $75,800 |
| 2019 | $2,563 | $81,280 | $12,160 | $69,120 |
| 2018 | $2,340 | $78,600 | $12,160 | $66,440 |
| 2017 | $2,328 | $78,920 | $12,160 | $66,760 |
| 2016 | $2,328 | $77,920 | $12,160 | $65,760 |
| 2015 | $2,538 | $78,720 | $12,160 | $66,560 |
| 2014 | $4,056 | $88,920 | $0 | $0 |
Source: Public Records
Map
Nearby Homes
- 127 Pine View Crossing
- 120 Pine View Crossing
- 7 Rolling Springs Ln
- 1335 Pine Barren Rd
- 137 Lake House Rd
- 178 Somersby Blvd
- 219 Somersby Blvd
- 110 Coach House Square
- 108 Coach House Square
- 1726 Pine Barren Rd
- 405 Olde Ivey Square
- 411 Olde Ivey Square
- 227 Somersby Blvd
- 413 Old Ivy Square
- 415 Olde Ivey Square
- 1325 Pine Barren Rd
- 304 Morgan Pines Dr
- 314 Morgan Pines Dr
- 507 Potter Stone Square
- 509 Potter Stone Square
- 161 Pine View Crossing
- 159 Pine View Crossing
- 163 Pine View Crossing
- 165 Pine View Crossing
- 154 Pine View Crossing
- 167 Pine View Crossing
- 152 Pine View Crossing
- 220 Pine View Crossing
- 156 Pine View Crossing
- 169 Pine View Crossing
- 157 Pine View Crossing
- 146 Pine View Crossing
- 155 Pine View Crossing
- 153 Pine View Crossing
- 151 Pine View Crossing
- 144 Pine View Crossing
- 141 Somersby Blvd
- 143 Somersby Blvd
- 149 Pine View Crossing
- 139 Somersby Blvd
Your Personal Tour Guide
Ask me questions while you tour the home.