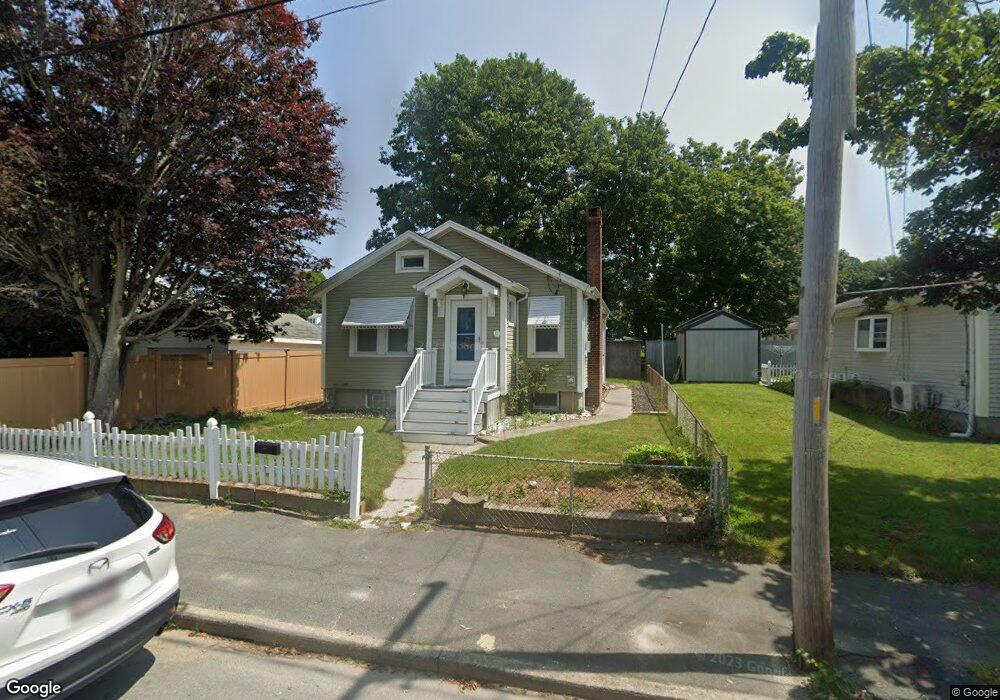
161 Pleasant St Fairhaven, MA 02719
Estimated Value: $269,000 - $413,000
2
Beds
1
Bath
924
Sq Ft
$380/Sq Ft
Est. Value
About This Home
This home is located at 161 Pleasant St, Fairhaven, MA 02719 and is currently estimated at $351,198, approximately $380 per square foot. 161 Pleasant St is a home located in Bristol County with nearby schools including Fairhaven High School, City On A Hill Charter Public School New Bedford, and St. Joseph School.
Ownership History
Date
Name
Owned For
Owner Type
Purchase Details
Closed on
Aug 31, 2018
Sold by
Marien Celeste A
Bought by
Foose Dana M
Current Estimated Value
Home Financials for this Owner
Home Financials are based on the most recent Mortgage that was taken out on this home.
Original Mortgage
$200,000
Outstanding Balance
$174,053
Interest Rate
4.5%
Mortgage Type
VA
Estimated Equity
$177,145
Purchase Details
Closed on
Nov 26, 1997
Sold by
Ring Alberta C and Silver Robert H
Bought by
Marien Celeste Ann
Create a Home Valuation Report for This Property
The Home Valuation Report is an in-depth analysis detailing your home's value as well as a comparison with similar homes in the area
Home Values in the Area
Average Home Value in this Area
Purchase History
| Date | Buyer | Sale Price | Title Company |
|---|---|---|---|
| Foose Dana M | $200,000 | -- | |
| Marien Celeste Ann | $79,900 | -- |
Source: Public Records
Mortgage History
| Date | Status | Borrower | Loan Amount |
|---|---|---|---|
| Open | Foose Dana M | $200,000 | |
| Previous Owner | Marien Celeste Ann | $160,115 | |
| Previous Owner | Marien Celeste Ann | $132,900 | |
| Previous Owner | Marien Celeste Ann | $120,400 | |
| Previous Owner | Marien Celeste Ann | $40,000 |
Source: Public Records
Tax History
| Year | Tax Paid | Tax Assessment Tax Assessment Total Assessment is a certain percentage of the fair market value that is determined by local assessors to be the total taxable value of land and additions on the property. | Land | Improvement |
|---|---|---|---|---|
| 2025 | $27 | $287,800 | $167,800 | $120,000 |
| 2024 | $2,600 | $281,700 | $167,800 | $113,900 |
| 2023 | $2,527 | $254,000 | $147,000 | $107,000 |
| 2022 | $2,637 | $258,000 | $136,600 | $121,400 |
| 2021 | $2,504 | $221,800 | $123,600 | $98,200 |
| 2020 | $2,453 | $221,800 | $123,600 | $98,200 |
| 2019 | $2,251 | $192,900 | $102,500 | $90,400 |
| 2018 | $2,154 | $183,000 | $97,600 | $85,400 |
| 2017 | $2,120 | $176,100 | $97,600 | $78,500 |
| 2016 | $2,061 | $169,200 | $97,600 | $71,600 |
| 2015 | $2,029 | $167,000 | $97,600 | $69,400 |
Source: Public Records
Map
Nearby Homes
Your Personal Tour Guide
Ask me questions while you tour the home.