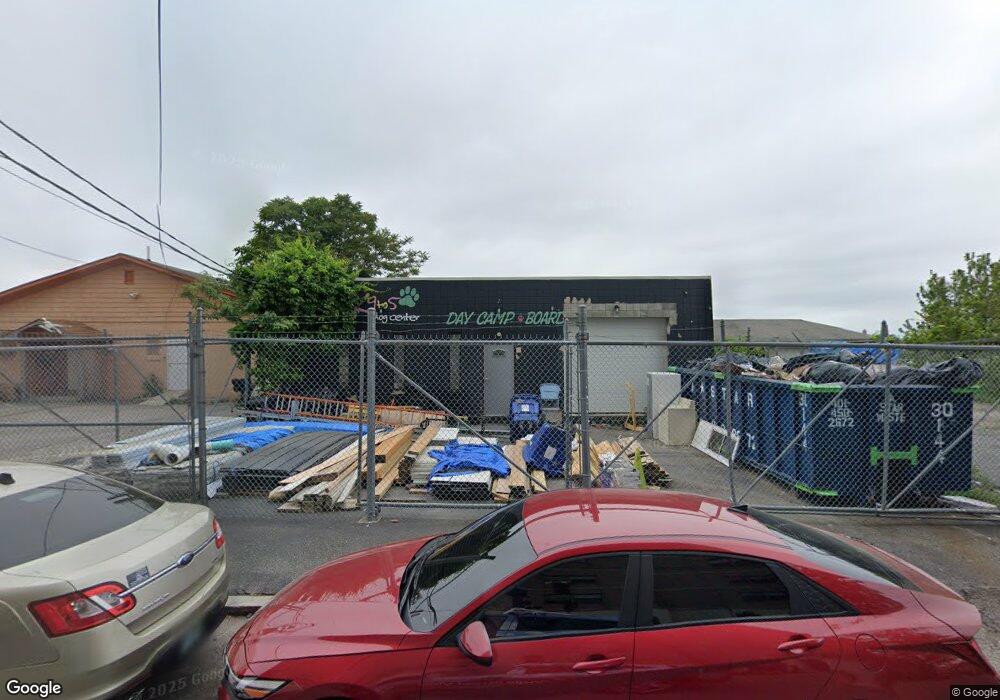
161 Ridge St Providence, RI 02909
West End NeighborhoodEstimated Value: $332,824
Studio
--
Bath
2,400
Sq Ft
$139/Sq Ft
Est. Value
About This Home
This home is located at 161 Ridge St, Providence, RI 02909 and is currently estimated at $332,824, approximately $138 per square foot. 161 Ridge St is a home located in Providence County with nearby schools including Paul Cuffee Middle School, Holy Ghost School, and Bradley School—Providence.
Ownership History
Date
Name
Owned For
Owner Type
Purchase Details
Closed on
Jun 24, 2021
Sold by
161 Ridge St Realty Llc
Bought by
161 Ridge Llc
Current Estimated Value
Purchase Details
Closed on
May 3, 2010
Sold by
Ri Blown In Celluloss
Bought by
161 Ridge Realty Llc
Purchase Details
Closed on
Apr 30, 2009
Sold by
Scott Realty Llc
Bought by
Rhode Island Blown Inc and Cellulose Insulation I
Home Financials for this Owner
Home Financials are based on the most recent Mortgage that was taken out on this home.
Original Mortgage
$132,000
Interest Rate
4.86%
Mortgage Type
Commercial
Purchase Details
Closed on
May 12, 2005
Sold by
Omni Ridge 161 Llc
Bought by
Scott Realty Llc
Home Financials for this Owner
Home Financials are based on the most recent Mortgage that was taken out on this home.
Original Mortgage
$240,000
Interest Rate
6.05%
Mortgage Type
Commercial
Create a Home Valuation Report for This Property
The Home Valuation Report is an in-depth analysis detailing your home's value as well as a comparison with similar homes in the area
Home Values in the Area
Average Home Value in this Area
Purchase History
| Date | Buyer | Sale Price | Title Company |
|---|---|---|---|
| 161 Ridge Llc | $250,000 | None Available | |
| 161 Ridge Realty Llc | -- | -- | |
| Rhode Island Blown Inc | $165,000 | -- | |
| Scott Realty Llc | $175,000 | -- |
Source: Public Records
Mortgage History
| Date | Status | Borrower | Loan Amount |
|---|---|---|---|
| Previous Owner | Scott Realty Llc | $132,000 | |
| Previous Owner | Scott Realty Llc | $240,000 |
Source: Public Records
Tax History
| Year | Tax Paid | Tax Assessment Tax Assessment Total Assessment is a certain percentage of the fair market value that is determined by local assessors to be the total taxable value of land and additions on the property. | Land | Improvement |
|---|---|---|---|---|
| 2025 | $8,608 | $294,800 | $114,400 | $180,400 |
| 2024 | $7,957 | $226,700 | $76,200 | $150,500 |
| 2023 | $7,957 | $226,700 | $76,200 | $150,500 |
| 2022 | $8,025 | $226,700 | $76,200 | $150,500 |
| 2021 | $7,112 | $193,800 | $60,500 | $133,300 |
| 2020 | $7,112 | $193,800 | $60,500 | $133,300 |
| 2019 | $7,112 | $193,800 | $60,500 | $133,300 |
| 2018 | $6,503 | $177,200 | $60,500 | $116,700 |
| 2017 | $6,503 | $177,200 | $60,500 | $116,700 |
| 2016 | $6,503 | $177,200 | $60,500 | $116,700 |
| 2015 | $5,898 | $160,500 | $57,600 | $102,900 |
| 2014 | $5,898 | $160,500 | $57,600 | $102,900 |
| 2013 | $5,898 | $160,500 | $57,600 | $102,900 |
Source: Public Records
Map
Nearby Homes
- 143 Tell St Unit B
- 498 Broadway
- 215 Valley St
- 10 Slocum St Unit 5
- 1447 Westminster St Unit 1C
- 1516 Westminster St
- 14 Parade St
- 31 Bowdoin St
- 20 Bowdoin St
- 21 Grant St
- 13 Benton St
- 6 Bailey Ct
- 12 Benton St
- 102 Vinton St
- 316 Valley St
- 755 Atwells Ave
- 58 Sutton St Unit 6
- 336 Atwells Ave
- 88 Julian St
- 132 Putnam St
Your Personal Tour Guide
Ask me questions while you tour the home.