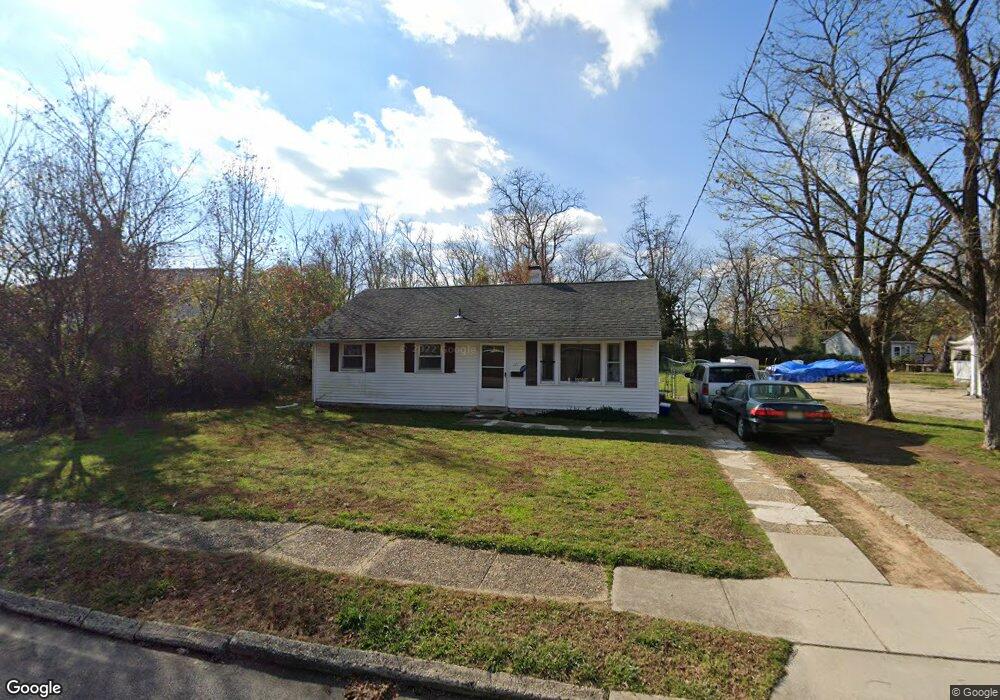
161 S Dennis Dr Clayton, NJ 08312
Estimated Value: $233,283 - $266,000
3
Beds
1
Bath
912
Sq Ft
$274/Sq Ft
Est. Value
About This Home
This home is located at 161 S Dennis Dr, Clayton, NJ 08312 and is currently estimated at $249,821, approximately $273 per square foot. 161 S Dennis Dr is a home located in Gloucester County with nearby schools including Herma S. Simmons Elementary School, Clayton Middle School, and Clayton High School.
Ownership History
Date
Name
Owned For
Owner Type
Purchase Details
Closed on
Nov 21, 2011
Sold by
Dremow Nicholas and Dremow Kori
Bought by
Knee Jason
Current Estimated Value
Home Financials for this Owner
Home Financials are based on the most recent Mortgage that was taken out on this home.
Original Mortgage
$51,000
Interest Rate
3.93%
Mortgage Type
New Conventional
Purchase Details
Closed on
May 24, 2006
Sold by
Gregorio Letizia
Bought by
Dremow Nicholas and Dremow Kori
Home Financials for this Owner
Home Financials are based on the most recent Mortgage that was taken out on this home.
Original Mortgage
$149,413
Interest Rate
6.62%
Mortgage Type
Purchase Money Mortgage
Purchase Details
Closed on
Oct 5, 2000
Sold by
Calabrese Paul G
Bought by
Va
Purchase Details
Closed on
May 6, 1993
Sold by
Calabrese Paul G and Calabrese Diane L
Bought by
Calabrese Paul G
Create a Home Valuation Report for This Property
The Home Valuation Report is an in-depth analysis detailing your home's value as well as a comparison with similar homes in the area
Home Values in the Area
Average Home Value in this Area
Purchase History
| Date | Buyer | Sale Price | Title Company |
|---|---|---|---|
| Knee Jason | $68,000 | Chicago Title Insurance Co | |
| Dremow Nicholas | $151,000 | -- | |
| Va | -- | -- | |
| Calabrese Paul G | -- | -- |
Source: Public Records
Mortgage History
| Date | Status | Borrower | Loan Amount |
|---|---|---|---|
| Previous Owner | Knee Jason | $51,000 | |
| Previous Owner | Dremow Nicholas | $149,413 |
Source: Public Records
Tax History Compared to Growth
Tax History
| Year | Tax Paid | Tax Assessment Tax Assessment Total Assessment is a certain percentage of the fair market value that is determined by local assessors to be the total taxable value of land and additions on the property. | Land | Improvement |
|---|---|---|---|---|
| 2025 | $5,413 | $218,700 | $58,500 | $160,200 |
| 2024 | $3,972 | $218,700 | $58,500 | $160,200 |
| 2023 | $3,972 | $98,300 | $29,500 | $68,800 |
| 2022 | $3,929 | $98,300 | $29,500 | $68,800 |
| 2021 | $3,882 | $98,300 | $29,500 | $68,800 |
| 2020 | $3,890 | $98,300 | $29,500 | $68,800 |
| 2019 | $3,824 | $98,300 | $29,500 | $68,800 |
| 2018 | $3,770 | $98,300 | $29,500 | $68,800 |
| 2017 | $3,706 | $98,300 | $29,500 | $68,800 |
| 2016 | $3,667 | $98,300 | $29,500 | $68,800 |
| 2015 | $3,558 | $98,300 | $29,500 | $68,800 |
| 2014 | $3,435 | $98,300 | $29,500 | $68,800 |
Source: Public Records
Map
Nearby Homes
- 170 S Dennis Dr
- 180 S Dennis Dr
- 807 N New St
- 216 E Howard St
- 6 Dubois Ave
- 35 W Dehart Ave
- 13 W Dehart Ave
- 510 Coleman Dr
- 124 W Howard St
- 131 W Clinton St
- 320 E Clayton Ave
- 100 Aura Rd Unit 112
- 100 Aura Rd Unit 212
- 100 Aura Rd Unit 311
- 100 Aura Rd Unit 111
- 100 Aura Rd Unit 110
- 238 W Center St
- 125 W Clayton Ave
- 7 Hawthorn Way
- 338 Sugar Hill Dr
- 157 S Dennis Dr
- 165 S Dennis Dr
- 153 S Dennis Dr
- 169 S Dennis Dr
- 164 S Dennis Dr
- 817 N New St
- 156 S Dennis Dr
- 160 S Dennis Dr
- 149 S Dennis Dr
- 168 S Dennis Dr
- 154 S Dennis Dr
- 173 S Dennis Dr
- 819 N New St
- 815 N New St
- 152 S Dennis Dr
- 2 Alexander Place Unit M25B
- 1 Alexander Place
- 148 S Dennis Dr
- 145 S Dennis Dr
- 175 S Dennis Dr