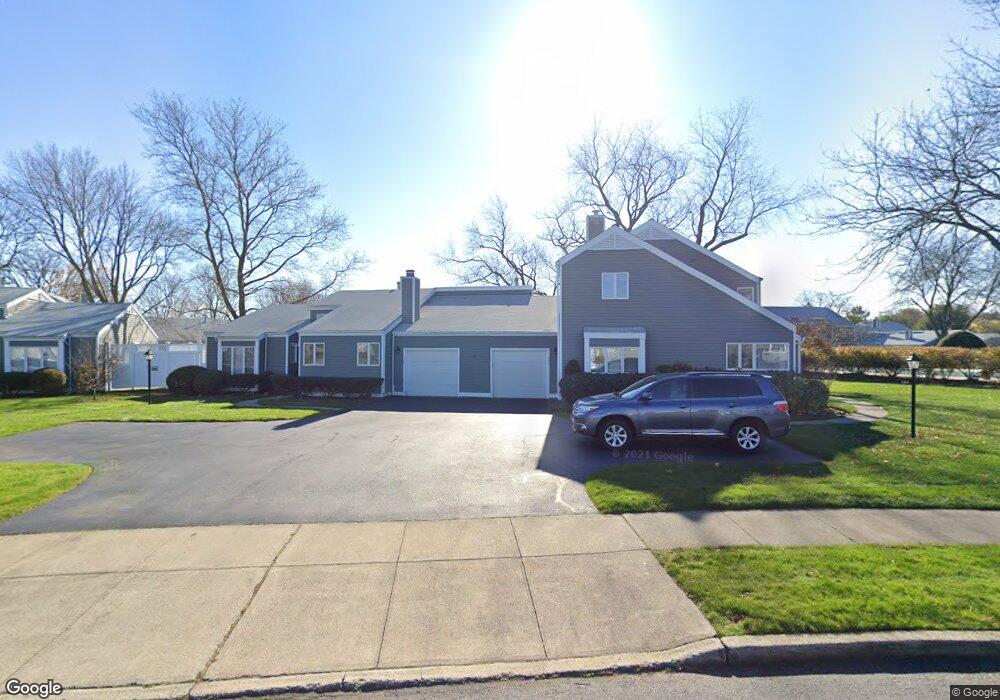
161 Salt Meadow Rd Fairfield, CT 06824
Fairfield Beach NeighborhoodEstimated Value: $672,000 - $1,250,980
3
Beds
3
Baths
2,308
Sq Ft
$464/Sq Ft
Est. Value
About This Home
This home is located at 161 Salt Meadow Rd, Fairfield, CT 06824 and is currently estimated at $1,070,245, approximately $463 per square foot. 161 Salt Meadow Rd is a home located in Fairfield County with nearby schools including Mill Hill School, Roger Ludlowe Middle School, and Fairfield Ludlowe High School.
Ownership History
Date
Name
Owned For
Owner Type
Purchase Details
Closed on
May 31, 2023
Sold by
Braun Nancy D
Bought by
Nancy D Braun Ret
Current Estimated Value
Purchase Details
Closed on
Oct 6, 2016
Sold by
Braun David K and Braun Nancy D
Bought by
Braun Nancy D
Purchase Details
Closed on
Oct 21, 2010
Sold by
Paul Gibian T and Gibian Timothy A
Bought by
Braun David K and Braun Nancy D
Purchase Details
Closed on
Mar 15, 2005
Sold by
Seabrook 3Rd William C and Seabrook Harley P
Bought by
Gibian Paul and Gibian Martha
Purchase Details
Closed on
Aug 26, 1994
Sold by
Manbeck Harry F
Bought by
Seabrook William C and Seabrook Harley P
Purchase Details
Closed on
Mar 31, 1987
Sold by
Grabeau Patrick P
Bought by
Manbeck Harry F
Create a Home Valuation Report for This Property
The Home Valuation Report is an in-depth analysis detailing your home's value as well as a comparison with similar homes in the area
Home Values in the Area
Average Home Value in this Area
Purchase History
| Date | Buyer | Sale Price | Title Company |
|---|---|---|---|
| Nancy D Braun Ret | -- | None Available | |
| Nancy D Braun Ret | -- | None Available | |
| Braun Nancy D | -- | -- | |
| Braun Nancy D | -- | -- | |
| Braun David K | $368,500 | -- | |
| Braun David K | $368,500 | -- | |
| Paul Gibian T | -- | -- | |
| Braun David K | $368,500 | -- | |
| Gibian Paul | $829,000 | -- | |
| Gibian Paul | $829,000 | -- | |
| Seabrook William C | $330,000 | -- | |
| Seabrook William C | $330,000 | -- | |
| Manbeck Harry F | $365,000 | -- |
Source: Public Records
Mortgage History
| Date | Status | Borrower | Loan Amount |
|---|---|---|---|
| Closed | Manbeck Harry F | $0 |
Source: Public Records
Tax History Compared to Growth
Tax History
| Year | Tax Paid | Tax Assessment Tax Assessment Total Assessment is a certain percentage of the fair market value that is determined by local assessors to be the total taxable value of land and additions on the property. | Land | Improvement |
|---|---|---|---|---|
| 2025 | $13,746 | $484,190 | $0 | $484,190 |
| 2024 | $13,509 | $484,190 | $0 | $484,190 |
| 2023 | $13,320 | $484,190 | $0 | $484,190 |
| 2022 | $13,189 | $484,190 | $0 | $484,190 |
| 2021 | $13,063 | $484,190 | $0 | $484,190 |
| 2020 | $13,716 | $511,980 | $0 | $511,980 |
| 2019 | $13,716 | $511,980 | $0 | $511,980 |
| 2018 | $13,496 | $511,980 | $0 | $511,980 |
| 2017 | $13,219 | $511,980 | $0 | $511,980 |
| 2016 | $13,030 | $511,980 | $0 | $511,980 |
| 2015 | $13,131 | $529,690 | $0 | $529,690 |
| 2014 | $12,924 | $529,690 | $0 | $529,690 |
Source: Public Records
Map
Nearby Homes
- 97 Field Point Dr
- 972 S Pine Creek Rd
- 154 Gorham Rd
- 775 Sasco Hill Rd
- 828 Sasco Hill Rd
- 2 Mellow St
- 1131 Sasco Hill Rd
- 85 Patrick Dr
- 127 Paul Place
- 1410 S Pine Creek Rd
- 57 Beaumont Place
- 209 S Pine Creek Rd
- 226 Ruane St
- 2142 Fairfield Beach Rd
- 2117 Fairfield Beach Rd
- 196 Catherine Terrace
- 43 Helen St
- 294 Catherine Terrace
- 100 Overhill Rd
- 88 Overhill Rd
- 161 Salt Meadow Rd Unit 161
- 163 Salt Meadow Rd
- 163 Salt Meadow Rd Unit 163
- 165 Salt Meadow Rd
- 167 Salt Meadow Rd
- 131 Field Point Dr
- 89 Field Point Dr
- 150 Salt Meadow Rd
- 152 Salt Meadow Rd
- 129 Field Point Dr
- 129 Field Point Dr Unit 129
- 91 Field Point Dr
- 84 Salt Meadow Rd
- 154 Salt Meadow Rd
- 156 Salt Meadow Rd
- 81 Field Point Dr
- 127 Field Point Dr
- 86 Salt Meadow Rd
- 93 Field Point Dr
- 93 Field Point Dr Unit 93