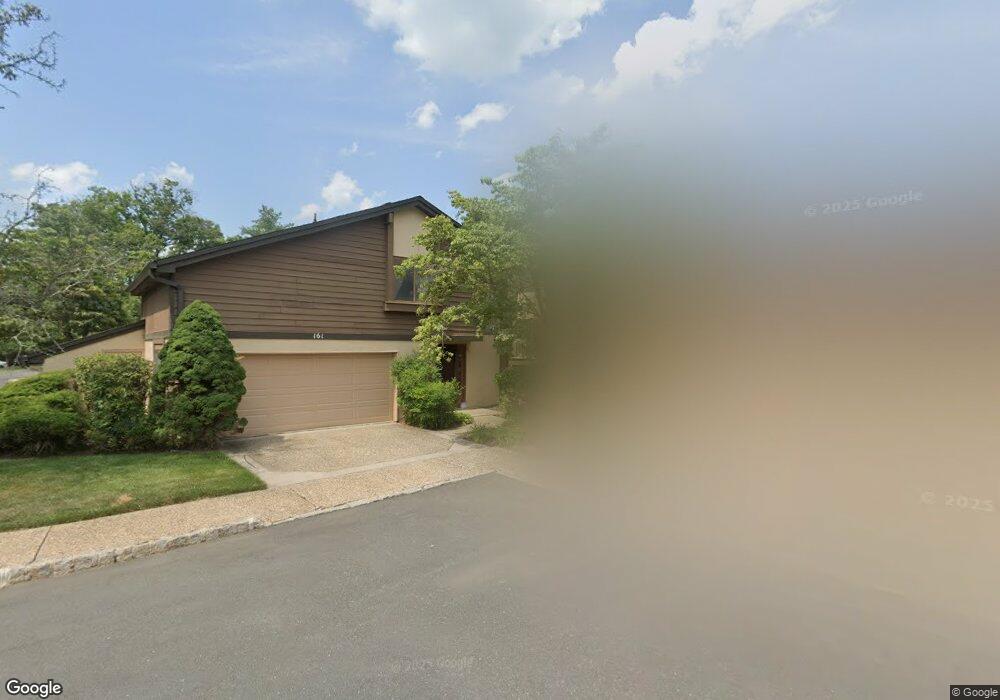
161 Sayre Dr Princeton, NJ 08540
Estimated Value: $675,009 - $751,000
--
Bed
--
Bath
1,814
Sq Ft
$399/Sq Ft
Est. Value
About This Home
This home is located at 161 Sayre Dr, Princeton, NJ 08540 and is currently estimated at $724,252, approximately $399 per square foot. 161 Sayre Dr is a home located in Middlesex County with nearby schools including Town Center Elementary School, Millstone River School, and Thomas R. Grover Middle School.
Ownership History
Date
Name
Owned For
Owner Type
Purchase Details
Closed on
Feb 21, 2019
Sold by
Matukhin Alexander and Klyachman Inna
Bought by
Matujhin Alexander and Klyachman Inna
Current Estimated Value
Purchase Details
Closed on
Aug 12, 2003
Purchase Details
Closed on
May 18, 1999
Sold by
Chan David
Bought by
Matukhin Alexander and Klyachman Inna
Home Financials for this Owner
Home Financials are based on the most recent Mortgage that was taken out on this home.
Original Mortgage
$159,000
Interest Rate
6.92%
Create a Home Valuation Report for This Property
The Home Valuation Report is an in-depth analysis detailing your home's value as well as a comparison with similar homes in the area
Home Values in the Area
Average Home Value in this Area
Purchase History
| Date | Buyer | Sale Price | Title Company |
|---|---|---|---|
| Matujhin Alexander | -- | None Available | |
| -- | -- | -- | |
| Matukhin Alexander | $212,000 | -- |
Source: Public Records
Mortgage History
| Date | Status | Borrower | Loan Amount |
|---|---|---|---|
| Previous Owner | Matukhin Alexander | $159,000 |
Source: Public Records
Tax History Compared to Growth
Tax History
| Year | Tax Paid | Tax Assessment Tax Assessment Total Assessment is a certain percentage of the fair market value that is determined by local assessors to be the total taxable value of land and additions on the property. | Land | Improvement |
|---|---|---|---|---|
| 2025 | $11,764 | $450,200 | $125,000 | $325,200 |
| 2024 | $11,480 | $450,200 | $125,000 | $325,200 |
| 2023 | $11,480 | $450,200 | $125,000 | $325,200 |
| 2022 | $11,305 | $450,200 | $125,000 | $325,200 |
| 2021 | $9,730 | $433,100 | $125,000 | $308,100 |
| 2020 | $9,951 | $416,000 | $125,000 | $291,000 |
| 2019 | $9,730 | $416,000 | $125,000 | $291,000 |
| 2018 | $9,514 | $416,000 | $125,000 | $291,000 |
| 2017 | $9,244 | $416,000 | $125,000 | $291,000 |
| 2016 | $8,836 | $416,000 | $125,000 | $291,000 |
| 2015 | $9,710 | $384,700 | $140,000 | $244,700 |
| 2014 | $9,614 | $384,700 | $140,000 | $244,700 |
Source: Public Records
Map
Nearby Homes