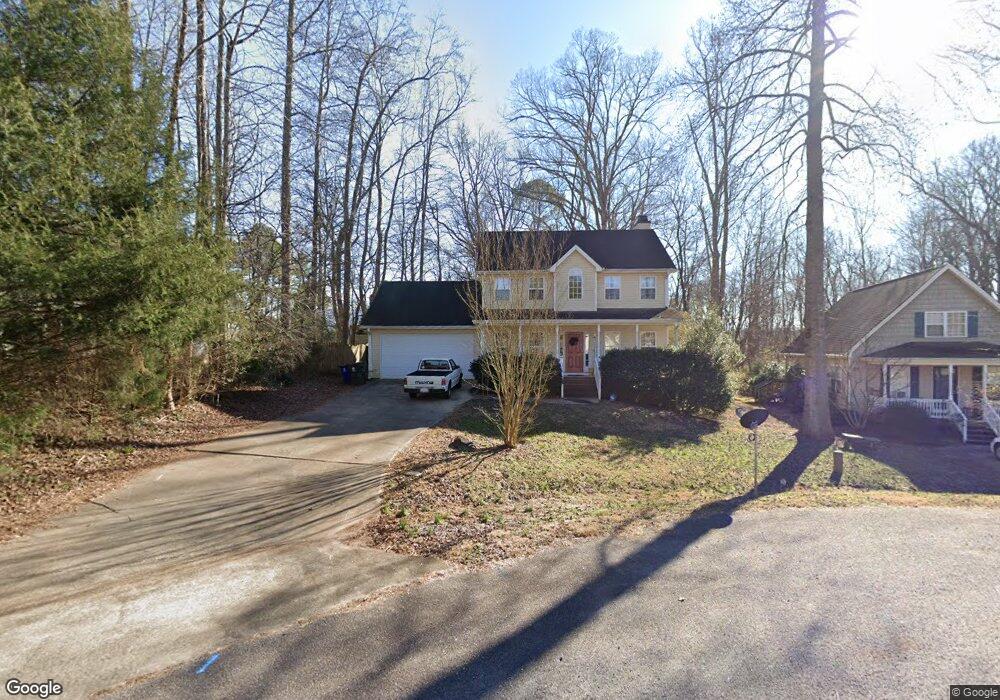
161 Thrift St Pittsboro, NC 27312
Estimated Value: $354,000 - $457,000
3
Beds
3
Baths
1,660
Sq Ft
$237/Sq Ft
Est. Value
About This Home
This home is located at 161 Thrift St, Pittsboro, NC 27312 and is currently estimated at $392,767, approximately $236 per square foot. 161 Thrift St is a home located in Chatham County with nearby schools including Pittsboro Elementary School, George Moses Horton Middle School, and Northwood High.
Ownership History
Date
Name
Owned For
Owner Type
Purchase Details
Closed on
Nov 4, 2014
Sold by
Coll Kerri and Creekmore Suzanne
Bought by
Covington Shebrah and Covington Kapreshia
Current Estimated Value
Home Financials for this Owner
Home Financials are based on the most recent Mortgage that was taken out on this home.
Original Mortgage
$185,576
Outstanding Balance
$141,851
Interest Rate
4.02%
Mortgage Type
FHA
Estimated Equity
$250,916
Purchase Details
Closed on
Apr 28, 2006
Sold by
Duinen Edwin Eric Van and Duinen Rita S Van
Bought by
Coll Kerri and Creekmore Suzanne
Home Financials for this Owner
Home Financials are based on the most recent Mortgage that was taken out on this home.
Original Mortgage
$140,800
Interest Rate
6.37%
Mortgage Type
Fannie Mae Freddie Mac
Create a Home Valuation Report for This Property
The Home Valuation Report is an in-depth analysis detailing your home's value as well as a comparison with similar homes in the area
Home Values in the Area
Average Home Value in this Area
Purchase History
| Date | Buyer | Sale Price | Title Company |
|---|---|---|---|
| Covington Shebrah | $189,000 | None Available | |
| Coll Kerri | $176,000 | None Available |
Source: Public Records
Mortgage History
| Date | Status | Borrower | Loan Amount |
|---|---|---|---|
| Open | Covington Shebrah | $185,576 | |
| Previous Owner | Coll Kerri | $140,800 |
Source: Public Records
Tax History Compared to Growth
Tax History
| Year | Tax Paid | Tax Assessment Tax Assessment Total Assessment is a certain percentage of the fair market value that is determined by local assessors to be the total taxable value of land and additions on the property. | Land | Improvement |
|---|---|---|---|---|
| 2025 | $3,857 | $347,309 | $49,200 | $298,109 |
| 2024 | $3,857 | $223,218 | $33,825 | $189,393 |
| 2023 | $2,835 | $223,218 | $33,825 | $189,393 |
| 2022 | $2,677 | $223,218 | $33,825 | $189,393 |
| 2021 | $2,652 | $223,218 | $33,825 | $189,393 |
| 2020 | $2,514 | $210,195 | $30,000 | $180,195 |
| 2019 | $2,504 | $210,195 | $30,000 | $180,195 |
| 2018 | $2,396 | $210,195 | $30,000 | $180,195 |
| 2017 | $2,396 | $210,195 | $30,000 | $180,195 |
| 2016 | $2,177 | $188,571 | $30,000 | $158,571 |
| 2015 | $2,155 | $188,571 | $30,000 | $158,571 |
| 2014 | $2,155 | $188,571 | $30,000 | $158,571 |
| 2013 | -- | $188,571 | $30,000 | $158,571 |
Source: Public Records
Map
Nearby Homes
- 0 N Carolina 902
- 00 N Carolina 902
- 507 W Salisbury St
- 248 Ashford Dr
- 000 Alston Chapel Rd
- 162 Gaines Trail
- 425 Credle St
- 230 Oakwood Dr
- 116 Kensington Dr
- 0 Nc 87 Hwy Unit 2491586
- 298 E Salisbury St
- 66 Toomer Loop Rd
- 54 Pattishall Rd
- 15 Juniper Ct
- 341 Windsong Dr
- Tbd Versailles Ln
- 24 Cynthia Ln
- 344 May Farm Rd
- 726 Thompson St
- 126 Roberson Creek Rd