Estimated Value: $377,309 - $454,000
--
Bed
--
Bath
3,122
Sq Ft
$135/Sq Ft
Est. Value
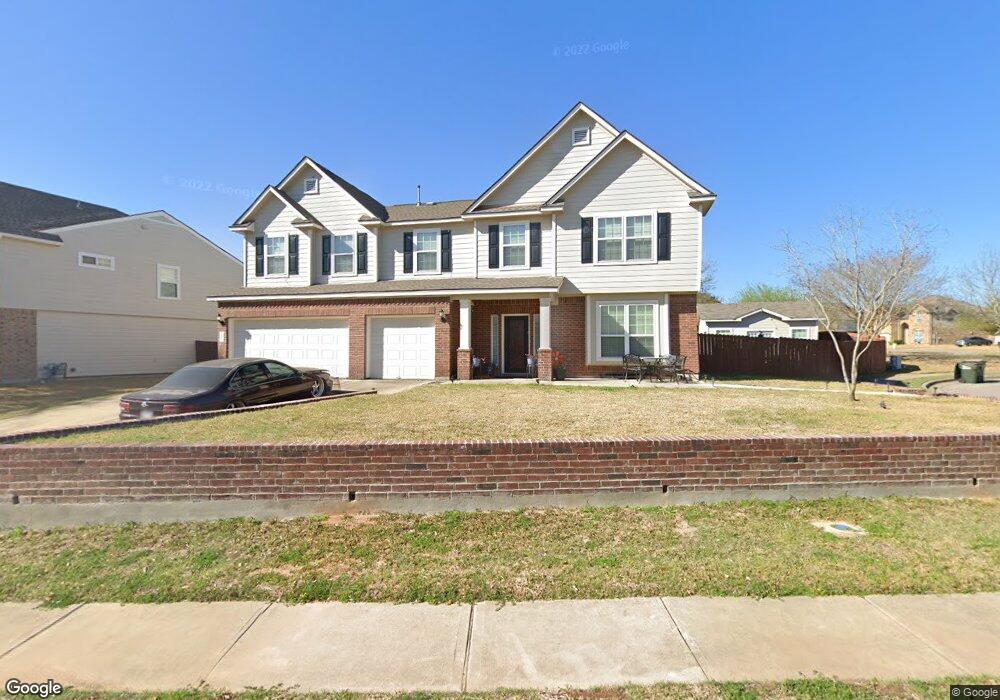
About This Home
This home is located at 161 Tulip Cove, Kyle, TX 78640 and is currently estimated at $420,577, approximately $134 per square foot. 161 Tulip Cove is a home located in Hays County with nearby schools including Kyle Elementary School, Laura B Wallace Middle School, and Jack C Hays High School.
Ownership History
Date
Name
Owned For
Owner Type
Purchase Details
Closed on
Aug 24, 2007
Sold by
Walker Jason Lee
Bought by
Nerio Gerard and Nerio Lucia
Current Estimated Value
Home Financials for this Owner
Home Financials are based on the most recent Mortgage that was taken out on this home.
Original Mortgage
$210,200
Outstanding Balance
$133,292
Interest Rate
6.69%
Mortgage Type
Purchase Money Mortgage
Estimated Equity
$287,285
Purchase Details
Closed on
Nov 9, 2004
Sold by
Rh Of Texas Lp
Bought by
Walker Jason Lee
Home Financials for this Owner
Home Financials are based on the most recent Mortgage that was taken out on this home.
Original Mortgage
$145,600
Interest Rate
5.87%
Mortgage Type
Purchase Money Mortgage
Purchase Details
Closed on
Mar 28, 2003
Sold by
Robinson Gregg A and Robinson R
Bought by
Nerio Gerard and Nerio Lucia
Create a Home Valuation Report for This Property
The Home Valuation Report is an in-depth analysis detailing your home's value as well as a comparison with similar homes in the area
Home Values in the Area
Average Home Value in this Area
Purchase History
| Date | Buyer | Sale Price | Title Company |
|---|---|---|---|
| Nerio Gerard | -- | San Marcos Title Co | |
| Walker Jason Lee | -- | Ryland Title | |
| Nerio Gerard | -- | -- |
Source: Public Records
Mortgage History
| Date | Status | Borrower | Loan Amount |
|---|---|---|---|
| Open | Nerio Gerard | $210,200 | |
| Previous Owner | Walker Jason Lee | $145,600 | |
| Closed | Walker Jason Lee | $18,200 |
Source: Public Records
Tax History Compared to Growth
Tax History
| Year | Tax Paid | Tax Assessment Tax Assessment Total Assessment is a certain percentage of the fair market value that is determined by local assessors to be the total taxable value of land and additions on the property. | Land | Improvement |
|---|---|---|---|---|
| 2025 | $7,743 | $430,780 | $74,340 | $356,440 |
| 2024 | $7,743 | $409,283 | $70,800 | $356,440 |
| 2023 | $8,203 | $372,075 | $94,160 | $411,610 |
| 2022 | $8,124 | $338,250 | $79,800 | $414,330 |
| 2021 | $8,025 | $307,500 | $42,000 | $265,500 |
| 2020 | $6,997 | $282,600 | $28,000 | $254,600 |
| 2019 | $7,712 | $283,760 | $28,000 | $255,760 |
| 2018 | $7,158 | $262,680 | $18,360 | $244,320 |
| 2017 | $7,015 | $252,840 | $18,360 | $234,480 |
| 2016 | $7,116 | $256,470 | $18,900 | $237,570 |
| 2015 | $5,578 | $228,060 | $18,000 | $210,060 |
Source: Public Records
Map
Nearby Homes
- 154 Larch Cove
- 161 Coneflower Dr
- 964 Hometown Pkwy
- 125 Pine Cove
- 952 Hometown Pkwy
- 215 Spruce Dr
- 292 Spruce Dr
- 376 Sweet Gum
- 201 Phillips Dr
- 1040 Verna Brooks Way
- 265 Fawn River Run
- 588 Bottle Brush Dr
- 273 Fawn River Run
- 261 Fawn River Run
- 125 Sweet Gum
- 369 Cold River Run
- 341 Fawn River Run
- 1332 Modoc Way
- 1372 Sweet Gum
- 598 Sweet Gum Dr
- 149 Tulip Cove
- 160 Tulip Cove
- 172 Tulip Cove
- 137 Tulip Cove
- 156 Tulip Cove
- 184 Tulip Cove
- 146 Tulip Cove
- 196 Tulip Cove
- 191 Greenbrier Dr
- 125 Tulip Cove
- 227 Hometown Pkwy
- 130 Larch Cove
- 138 Tulip Cove
- 257 Hometown Pkwy
- 239 Hometown Pkwy
- 203 Greenbrier Dr
- 209 Hometown Pkwy
- 281 Hometown Pkwy
- 185 Hometown Pkwy
- 161 Larch Cove