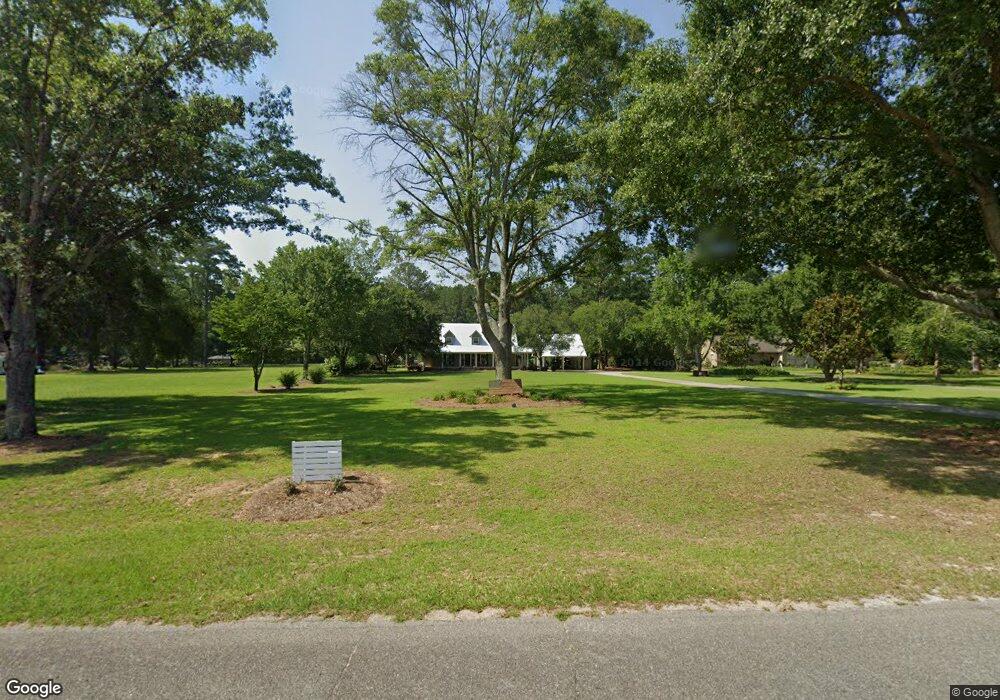
161 Valhalla Cordele, GA 31015
Estimated Value: $601,000 - $671,000
3
Beds
3
Baths
2,539
Sq Ft
$252/Sq Ft
Est. Value
About This Home
This home is located at 161 Valhalla, Cordele, GA 31015 and is currently estimated at $639,354, approximately $251 per square foot. 161 Valhalla is a home located in Crisp County with nearby schools including Crisp County Elementary School, Crisp County Primary School, and Crisp County Middle School.
Ownership History
Date
Name
Owned For
Owner Type
Purchase Details
Closed on
Aug 26, 2010
Sold by
Federal Home Loan Mortgage Corporation
Bought by
Wilson Amanda T
Current Estimated Value
Home Financials for this Owner
Home Financials are based on the most recent Mortgage that was taken out on this home.
Original Mortgage
$277,148
Outstanding Balance
$182,341
Interest Rate
4.6%
Mortgage Type
FHA
Estimated Equity
$457,013
Purchase Details
Closed on
Mar 2, 2010
Sold by
Ocwen Loan Servicing Llc
Bought by
Federal Home Loan Mortgage Corp
Purchase Details
Closed on
Aug 31, 2007
Sold by
Littleton Robert C
Bought by
Smarr Floyd Samuel
Purchase Details
Closed on
Nov 21, 1996
Sold by
Miller Robert W and Miller K
Bought by
Littleton Robert C
Purchase Details
Closed on
Feb 13, 1992
Sold by
Griffin Lumber Co
Bought by
Miller Robert W and Miller K
Create a Home Valuation Report for This Property
The Home Valuation Report is an in-depth analysis detailing your home's value as well as a comparison with similar homes in the area
Home Values in the Area
Average Home Value in this Area
Purchase History
| Date | Buyer | Sale Price | Title Company |
|---|---|---|---|
| Wilson Amanda T | $266,000 | -- | |
| Wilson Amanda T | $266,000 | -- | |
| Federal Home Loan Mortgage Corp | -- | -- | |
| Ocwen Loan Servicing Llc | $350,000 | -- | |
| Federal Home Loan Mortgage Corp | -- | -- | |
| Ocwen Loan Servicing Llc | $350,000 | -- | |
| Smarr Floyd Samuel | $385,000 | -- | |
| Smarr Floyd Samuel | $385,000 | -- | |
| Littleton Robert C | $175,000 | -- | |
| Littleton Robert C | $175,000 | -- | |
| Miller Robert W | $21,000 | -- | |
| Miller Robert W | $21,000 | -- |
Source: Public Records
Mortgage History
| Date | Status | Borrower | Loan Amount |
|---|---|---|---|
| Open | Wilson Amanda T | $277,148 | |
| Closed | Smarr Floyd Samuel | $0 |
Source: Public Records
Tax History Compared to Growth
Tax History
| Year | Tax Paid | Tax Assessment Tax Assessment Total Assessment is a certain percentage of the fair market value that is determined by local assessors to be the total taxable value of land and additions on the property. | Land | Improvement |
|---|---|---|---|---|
| 2025 | $5,848 | $218,000 | $79,997 | $138,003 |
| 2024 | $5,848 | $218,000 | $79,997 | $138,003 |
| 2023 | $5,655 | $203,357 | $85,335 | $118,022 |
| 2022 | $4,266 | $153,896 | $38,061 | $115,835 |
| 2021 | $4,016 | $135,439 | $38,061 | $97,378 |
| 2020 | $3,963 | $135,439 | $38,061 | $97,378 |
| 2019 | $3,938 | $135,439 | $38,061 | $97,378 |
| 2018 | $4,037 | $133,824 | $43,625 | $90,199 |
| 2017 | $4,115 | $133,824 | $43,625 | $90,199 |
| 2016 | $4,048 | $133,824 | $43,625 | $90,199 |
| 2015 | -- | $133,824 | $43,625 | $90,199 |
| 2014 | -- | $133,824 | $43,625 | $90,199 |
| 2013 | -- | $136,184 | $43,624 | $92,559 |
Source: Public Records
Map
Nearby Homes
- 177 N Valhalla Dr
- 117 N Valhalla Ln
- 0 the Retreat at Valhalla N
- 126 N Valhalla Dr
- 0 Valhalla Rd S Unit 138510
- 241 Valhalla Rd S Unit LOT 1
- 241 Valhalla Rd S Unit LOT 4
- 241 Valhalla Rd S Unit LOT 2
- 241 Valhalla Rd S Unit LOT 3
- 132 Valhalla Rd S
- 100 Valhalla
- 114 N Valhalla Dr
- 120 Valhalla Rd
- 0 Cannon Branch Rd Unit 179188
- 0 Cannon Branch Rd Unit 10635232
- Lot # 18 Cannon Branch Rd
- Lot #35 Cannon Branch Rd
- Lot #32 Cannon Branch Rd
- Lot # 30 Cannon Branch Rd
- Lot # 17 Cannon Branch Rd
- 161 N Valhalla Dr
- 165 N Valhalla Dr
- 157 N Valhalla Dr
- 169 N Valhalla Dr
- LOT 73 N Valhalla Dr
- Lot#99 N Valhalla Dr
- 154 - 9 N Valhalla Dr
- 154 - 8 N Valhalla Dr
- 154 - 7 N Valhalla Dr
- Lot # 80 N Valhalla Dr
- 91 N Valhalla Dr
- 0 N Valhalla Dr
- 155 N Valhalla Dr
- 155 N Valhalla Dr
- 153 N Valhalla Dr
- 173 N Valhalla Dr
- 135 N Valhalla Ct
- 149 N Valhalla Dr
- 131 N Valhalla Ct
- 129 N Valhalla Ct