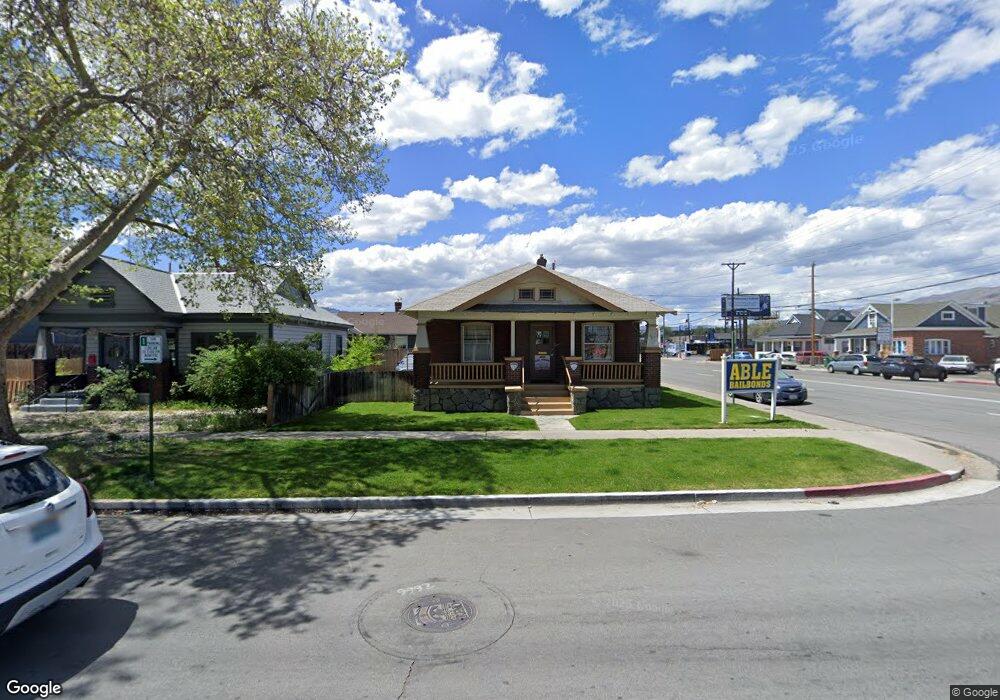
161 Vine St Reno, NV 89503
Riverwalk NeighborhoodEstimated Value: $474,433
3
Beds
2
Baths
2,000
Sq Ft
$237/Sq Ft
Est. Value
About This Home
This home is located at 161 Vine St, Reno, NV 89503 and is currently estimated at $474,433, approximately $237 per square foot. 161 Vine St is a home located in Washoe County with nearby schools including Hunter Lake Elementary School, Darrell C Swope Middle School, and Reno High School.
Ownership History
Date
Name
Owned For
Owner Type
Purchase Details
Closed on
Jun 6, 2017
Sold by
Potts Donna M
Bought by
Helton Daniel M and Potts Donna M
Current Estimated Value
Purchase Details
Closed on
Jul 14, 2004
Sold by
Allen Terry L
Bought by
Allen Martha S
Purchase Details
Closed on
Jul 7, 2004
Sold by
Allen Martha S
Bought by
Potts George B and Potts Donna M
Purchase Details
Closed on
Oct 28, 1994
Sold by
Hibbs Loyal Robert
Bought by
Zeff Aaron M
Home Financials for this Owner
Home Financials are based on the most recent Mortgage that was taken out on this home.
Original Mortgage
$145,905
Interest Rate
8.7%
Mortgage Type
Commercial
Purchase Details
Closed on
Jul 15, 1994
Sold by
Lee Terry J S
Bought by
Hibbs Loyal Robert
Create a Home Valuation Report for This Property
The Home Valuation Report is an in-depth analysis detailing your home's value as well as a comparison with similar homes in the area
Home Values in the Area
Average Home Value in this Area
Purchase History
| Date | Buyer | Sale Price | Title Company |
|---|---|---|---|
| Helton Daniel M | $217,500 | None Available | |
| Potts Donna M | -- | None Available | |
| Allen Martha S | -- | Stewart Title Of Northern Nv | |
| Potts George B | $217,500 | Stewart Title Of Northern Nv | |
| Zeff Aaron M | $142,000 | First Centennial Title Co | |
| Hibbs Loyal Robert | $99,000 | First Centennial Title Co |
Source: Public Records
Mortgage History
| Date | Status | Borrower | Loan Amount |
|---|---|---|---|
| Previous Owner | Zeff Aaron M | $145,905 |
Source: Public Records
Tax History Compared to Growth
Tax History
| Year | Tax Paid | Tax Assessment Tax Assessment Total Assessment is a certain percentage of the fair market value that is determined by local assessors to be the total taxable value of land and additions on the property. | Land | Improvement |
|---|---|---|---|---|
| 2025 | $2,210 | $78,524 | $50,225 | $28,299 |
| 2024 | $2,210 | $75,928 | $47,775 | $28,153 |
| 2023 | $2,047 | $71,303 | $45,325 | $25,978 |
| 2022 | $1,900 | $55,881 | $34,913 | $20,969 |
| 2021 | $1,764 | $47,283 | $26,950 | $20,333 |
| 2020 | $1,665 | $46,929 | $26,950 | $19,979 |
| 2019 | $1,583 | $43,442 | $24,500 | $18,942 |
| 2018 | $1,501 | $40,255 | $22,050 | $18,205 |
| 2017 | $1,492 | $39,974 | $22,050 | $17,924 |
| 2016 | $1,469 | $39,689 | $20,825 | $18,864 |
| 2015 | $394 | $39,303 | $20,825 | $18,478 |
| 2014 | -- | $38,204 | $20,825 | $17,379 |
| 2013 | -- | $37,757 | $20,825 | $16,932 |
Source: Public Records
Map
Nearby Homes
- 1200 Riverside Dr Unit 1276
- 1200 Riverside Dr Unit 1271
- 745 California Ave
- 631 California Ave
- 100 N Arlington Ave Unit 7K
- 100 N Arlington Ave Unit 22C
- 100 N Arlington Ave Unit 23-M
- 100 N Arlington Ave Unit 6E
- 100 N Arlington Ave Unit 23P
- 100 N Arlington Ave Unit 21K
- 100 N Arlington Ave Unit 10E
- 100 N Arlington Ave Unit 17G
- 100 N Arlington Ave Unit 20J
- 100 N Arlington Ave Unit 22G
- 100 N Arlington Ave Unit 22-H
- 100 N Arlington Ave Unit 6G
- 1450 Idlewild Dr Unit 1133
- 1450 Idlewild Dr Unit 616
- 200 W 2nd St Unit 1101
- 200 W 2nd St Unit 501
- 161 Vine St Unit 2
- 918 W 2nd St
- 151 1/2 Vine St
- 151 Vine St
- 151 1 2 Vine St
- 141 Vine St
- 888 W 2nd St
- 135 Vine St
- 919 W 2nd St
- 923 W 2nd St
- 923 W 2nd St Unit 4D
- 923 W 2nd St Unit 1B
- 923 W 2nd St Unit 5C
- 923 W 2nd St Unit 1B
- 144 Keystone Ave
- 133 Vine St Unit 133 - 135.5 Vine Str
- 221 Vine St
- 221 Vine St Unit 3
- 121 Vine St
- 123 Vine St