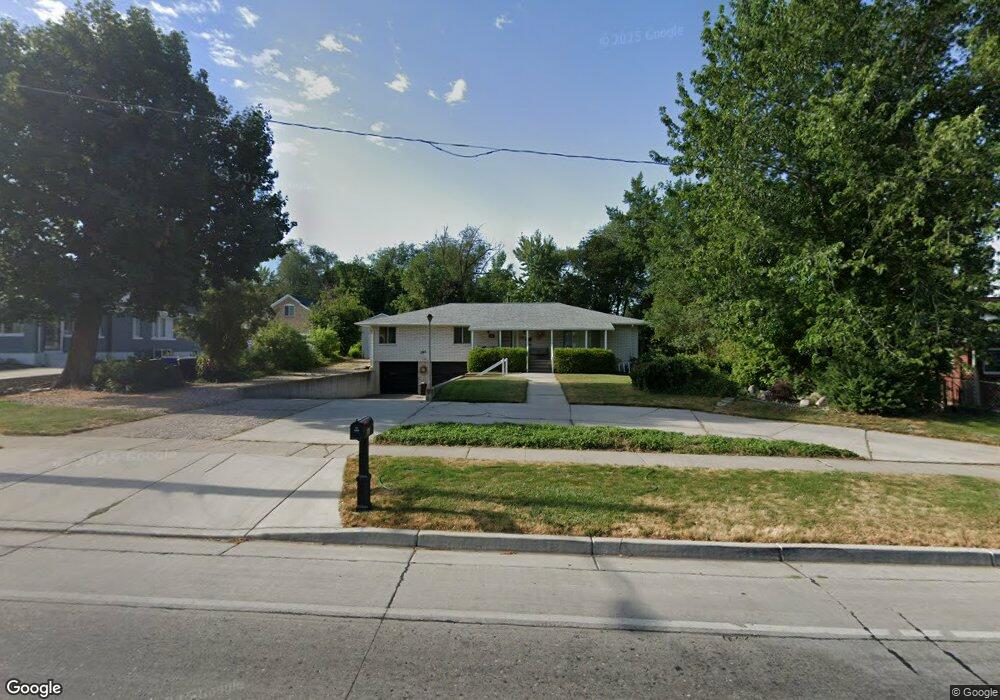
161 W 400 N Bountiful, UT 84010
Estimated Value: $591,000 - $627,000
3
Beds
3
Baths
1,874
Sq Ft
$322/Sq Ft
Est. Value
About This Home
This home is located at 161 W 400 N, Bountiful, UT 84010 and is currently estimated at $604,094, approximately $322 per square foot. 161 W 400 N is a home located in Davis County with nearby schools including Meadowbrook Elementary School, Bountiful Junior High School, and Bountiful High School.
Ownership History
Date
Name
Owned For
Owner Type
Purchase Details
Closed on
Mar 28, 2025
Sold by
Mangus Family Trust and Mangus Wallace B
Bought by
Mangus Wallace B and Mangus Ramona Lee
Current Estimated Value
Home Financials for this Owner
Home Financials are based on the most recent Mortgage that was taken out on this home.
Original Mortgage
$64,200
Outstanding Balance
$63,870
Interest Rate
6.85%
Mortgage Type
New Conventional
Estimated Equity
$540,224
Purchase Details
Closed on
Feb 21, 2007
Sold by
Mangus Wallace B and Mangus Ramona Lee
Bought by
Mangus Wallace B and Mangus Ramona Lee
Purchase Details
Closed on
Apr 5, 2000
Sold by
Mangus Wallace B
Bought by
Mangus Wallace B and Mangus Ramona Lee
Home Financials for this Owner
Home Financials are based on the most recent Mortgage that was taken out on this home.
Original Mortgage
$75,000
Interest Rate
7.96%
Create a Home Valuation Report for This Property
The Home Valuation Report is an in-depth analysis detailing your home's value as well as a comparison with similar homes in the area
Home Values in the Area
Average Home Value in this Area
Purchase History
| Date | Buyer | Sale Price | Title Company |
|---|---|---|---|
| Mangus Wallace B | -- | None Listed On Document | |
| Mangus Wallace B | -- | None Available | |
| Mangus Wallace B | -- | Associated Title Company | |
| Mangus Wallace B | -- | Associated Title Company |
Source: Public Records
Mortgage History
| Date | Status | Borrower | Loan Amount |
|---|---|---|---|
| Open | Mangus Wallace B | $64,200 | |
| Previous Owner | Mangus Wallace B | $75,000 |
Source: Public Records
Tax History Compared to Growth
Tax History
| Year | Tax Paid | Tax Assessment Tax Assessment Total Assessment is a certain percentage of the fair market value that is determined by local assessors to be the total taxable value of land and additions on the property. | Land | Improvement |
|---|---|---|---|---|
| 2025 | $3,552 | $317,900 | $131,975 | $185,925 |
| 2024 | $3,308 | $306,350 | $124,367 | $181,983 |
| 2023 | $3,258 | $549,000 | $222,749 | $326,251 |
| 2022 | $3,341 | $309,100 | $120,035 | $189,065 |
| 2021 | $2,947 | $417,000 | $157,346 | $259,654 |
| 2020 | $2,600 | $368,000 | $132,159 | $235,841 |
| 2019 | $2,637 | $365,000 | $125,191 | $239,809 |
| 2018 | $2,444 | $332,000 | $122,407 | $209,593 |
| 2016 | $2,177 | $160,600 | $54,964 | $105,636 |
| 2015 | $2,135 | $148,610 | $54,964 | $93,646 |
| 2014 | $2,184 | $157,159 | $54,964 | $102,195 |
| 2013 | -- | $114,469 | $46,560 | $67,909 |
Source: Public Records
Map
Nearby Homes
- 252 N Main St
- 499 N 200 W Unit 30
- 499 N 200 W Unit 19
- 256 N Main St
- 254 N Main St
- 51 E 200 N Unit 3
- 17 E 400 N Unit 27C
- 41 E 200 N Unit 6
- 55 E 200 N Unit 2
- 49 E 200 N Unit 4
- 59 E 200 N Unit 1
- 553 N 200 W
- 93 W 700 N
- 155 N Peregrine Ln W
- 131 W 25 N Unit 4
- 147 W 25 N Unit 5
- 810 Park Shadows Cir
- 314 W Center St Unit D135
- 314 W Center St Unit D159
- 16 W 700 N