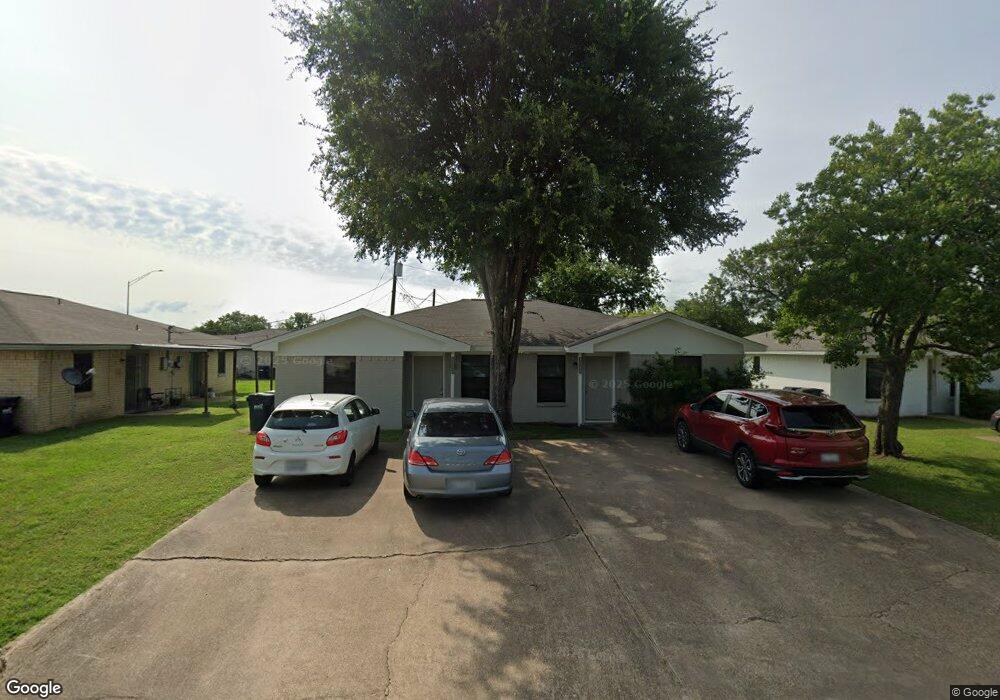
1610-12 Mossglenn College Station, TX 77840
South Knoll NeighborhoodEstimated Value: $202,815 - $318,000
--
Bed
--
Bath
1,596
Sq Ft
$151/Sq Ft
Est. Value
About This Home
This home is located at 1610-12 Mossglenn, College Station, TX 77840 and is currently estimated at $241,454, approximately $151 per square foot. 1610-12 Mossglenn is a home located in Brazos County with nearby schools including South Knoll Elementary School, A&M Consolidated Middle School, and Oakwood Intermediate School.
Ownership History
Date
Name
Owned For
Owner Type
Purchase Details
Closed on
Feb 13, 2017
Sold by
Garza Dorothy G
Bought by
Jennings Sonia R and Jennings John P
Current Estimated Value
Purchase Details
Closed on
Jan 30, 2017
Sold by
Mere Holdings Llc
Bought by
Garza Dorothy G
Purchase Details
Closed on
Apr 15, 2011
Sold by
Geva Uri and Zilbershtein Gali
Bought by
Alexander Billy Gene
Home Financials for this Owner
Home Financials are based on the most recent Mortgage that was taken out on this home.
Original Mortgage
$120,000
Interest Rate
4.25%
Mortgage Type
Purchase Money Mortgage
Purchase Details
Closed on
May 16, 2008
Sold by
St Joseph Foundation Of Bryan
Bought by
Anderson Swiki
Home Financials for this Owner
Home Financials are based on the most recent Mortgage that was taken out on this home.
Original Mortgage
$80,950
Interest Rate
5.86%
Mortgage Type
Purchase Money Mortgage
Create a Home Valuation Report for This Property
The Home Valuation Report is an in-depth analysis detailing your home's value as well as a comparison with similar homes in the area
Home Values in the Area
Average Home Value in this Area
Purchase History
| Date | Buyer | Sale Price | Title Company |
|---|---|---|---|
| Jennings Sonia R | -- | None Available | |
| Garza Dorothy G | -- | None Available | |
| Alexander Billy Gene | -- | Stewart Title Company | |
| Anderson Swiki | -- | Aggieland Title Company |
Source: Public Records
Mortgage History
| Date | Status | Borrower | Loan Amount |
|---|---|---|---|
| Previous Owner | Alexander Billy Gene | $120,000 | |
| Previous Owner | Anderson Swiki | $80,950 |
Source: Public Records
Tax History Compared to Growth
Tax History
| Year | Tax Paid | Tax Assessment Tax Assessment Total Assessment is a certain percentage of the fair market value that is determined by local assessors to be the total taxable value of land and additions on the property. | Land | Improvement |
|---|---|---|---|---|
| 2025 | $3,335 | $234,693 | $96,563 | $138,130 |
| 2024 | $3,335 | $175,000 | $92,049 | $82,951 |
| 2023 | $3,335 | $174,516 | $86,315 | $88,201 |
| 2022 | $2,853 | $133,813 | $66,490 | $67,323 |
| 2021 | $3,022 | $133,814 | $66,490 | $67,324 |
| 2020 | $3,063 | $134,867 | $66,490 | $68,377 |
| 2019 | $3,043 | $128,780 | $66,490 | $62,290 |
| 2018 | $2,976 | $125,000 | $58,740 | $66,260 |
| 2017 | $2,822 | $119,900 | $58,740 | $61,160 |
| 2016 | $2,810 | $119,390 | $51,240 | $68,150 |
| 2015 | $2,590 | $110,720 | $51,240 | $59,480 |
| 2014 | $2,590 | $111,780 | $51,240 | $60,540 |
Source: Public Records
Map
Nearby Homes
- 1526 Pine Ridge Dr
- 1526 Pine Ridge Dr Unit AD
- 1808 Potomac Place Unit AD
- 1808 Potomac Place Unit A
- 1810 Potomac Place Unit AD
- 1712 Glade St
- 1502 Glade St
- 1305 Laura Ln Unit CS
- 1700 Laura Ln Unit CS
- 1601 Langford St
- 1216 & 1218 & 309 Manuel Holik Dr Unit A-D
- 200 Yale Cir
- 102 A & 100 Sterling St
- 100 Sterling St
- 1801 Langford St
- 102 Sterling St Unit A
- 212 Yale Ct
- 1810 Laura Ln
- 1817 Laura Ln
- 106 A Sterling St
- 1610 Mossglenn Cir
- 1603 Mossglenn Cir
- 1604 Anderson St
- 1608 Mossglenn Cir
- 1612 Mossglenn Cir
- 1606 Mossglenn Cir
- 1606-08 Mossglenn
- 1602 Anderson St
- 1606 Anderson St
- 1608 Anderson St
- 1613 Cloverdale Ct
- 1615 Cloverdale Ct
- 1609 Cloverdale Ct
- 1602 Mossglenn Cir
- 1617 Cloverdale Ct
- 1619 Cloverdale Ct
- 1611 Cloverdale Ct
- 1504 Anderson St
- 1601 Mossglenn Cir
- 1605 Cloverdale Ct