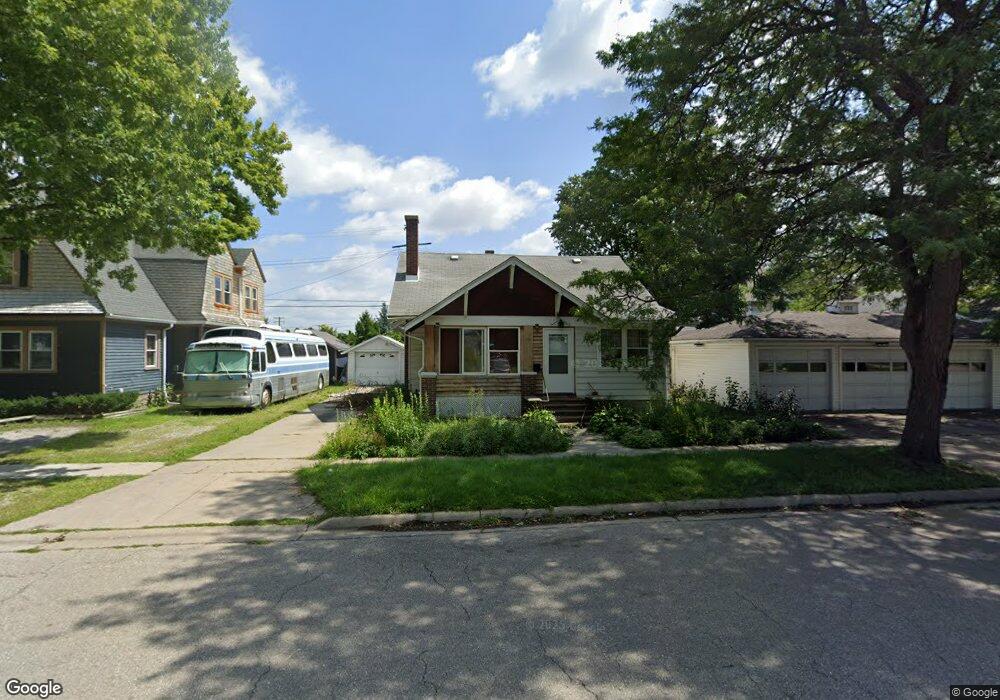
1610 6th St Port Huron, MI 48060
Estimated Value: $94,000 - $144,148
2
Beds
1
Bath
1,316
Sq Ft
$95/Sq Ft
Est. Value
About This Home
This home is located at 1610 6th St, Port Huron, MI 48060 and is currently estimated at $124,787, approximately $94 per square foot. 1610 6th St is a home located in St. Clair County with nearby schools including Woodrow Wilson Elementary School, Holland Woods Middle School, and Port Huron High School.
Ownership History
Date
Name
Owned For
Owner Type
Purchase Details
Closed on
Apr 5, 2024
Sold by
Bennett Marsha M
Bought by
Hawkins Franklin Charles
Current Estimated Value
Purchase Details
Closed on
Nov 6, 2008
Sold by
Foglesong Travin
Bought by
Bennett Richard and Bennett Marhsa M
Purchase Details
Closed on
Aug 14, 2008
Sold by
Webb Leoda S
Bought by
Foglesong Travis R
Purchase Details
Closed on
Aug 7, 2008
Sold by
Foglesong Travin R and Foglesong Leoda S
Bought by
First Mortgage Llc
Create a Home Valuation Report for This Property
The Home Valuation Report is an in-depth analysis detailing your home's value as well as a comparison with similar homes in the area
Home Values in the Area
Average Home Value in this Area
Purchase History
| Date | Buyer | Sale Price | Title Company |
|---|---|---|---|
| Hawkins Franklin Charles | -- | None Listed On Document | |
| Hawkins Franklin Charles | -- | None Listed On Document | |
| Bennett Richard | $41,000 | None Available | |
| Foglesong Travis R | -- | None Available | |
| First Mortgage Llc | $61,716 | None Available |
Source: Public Records
Tax History Compared to Growth
Tax History
| Year | Tax Paid | Tax Assessment Tax Assessment Total Assessment is a certain percentage of the fair market value that is determined by local assessors to be the total taxable value of land and additions on the property. | Land | Improvement |
|---|---|---|---|---|
| 2025 | $1,586 | $61,300 | $0 | $0 |
| 2024 | $1,176 | $58,000 | $0 | $0 |
| 2023 | $1,578 | $50,800 | $0 | $0 |
| 2022 | $1,559 | $42,200 | $0 | $0 |
| 2021 | $1,489 | $37,400 | $0 | $0 |
| 2020 | $1,495 | $33,000 | $33,000 | $0 |
| 2019 | $1,468 | $23,200 | $0 | $0 |
| 2018 | $1,436 | $23,200 | $0 | $0 |
| 2017 | $1,318 | $21,700 | $0 | $0 |
| 2016 | $1,169 | $21,700 | $0 | $0 |
| 2015 | $1,217 | $21,700 | $21,700 | $0 |
| 2014 | $1,217 | $22,600 | $22,600 | $0 |
| 2013 | -- | $24,900 | $0 | $0 |
Source: Public Records
Map
Nearby Homes