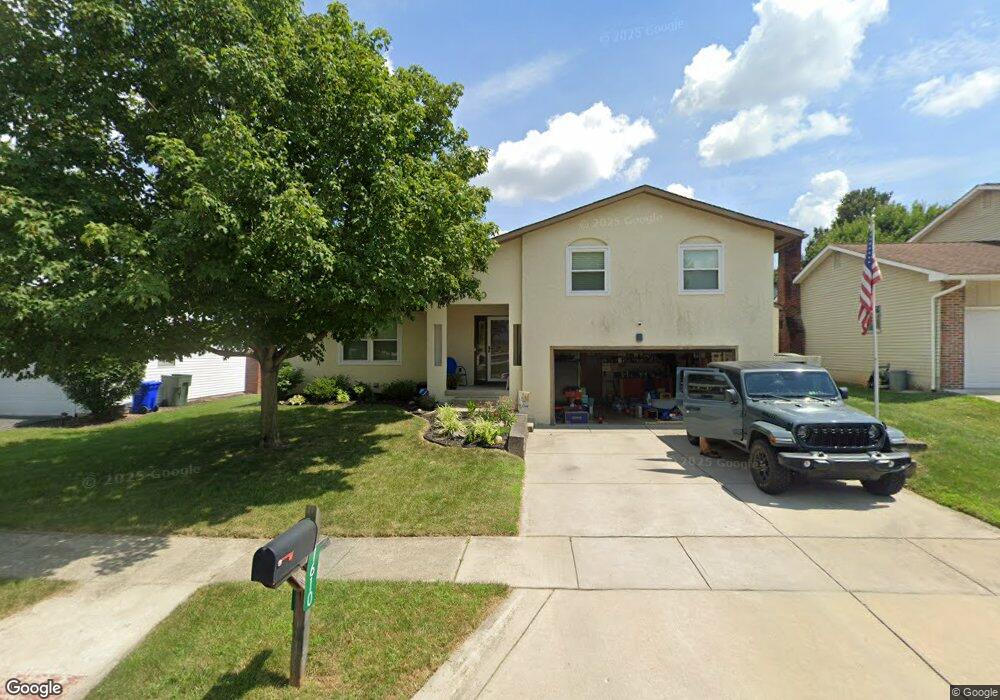
1610 Delgany St Columbus, OH 43228
Riverbend NeighborhoodEstimated Value: $247,000 - $274,000
3
Beds
3
Baths
1,354
Sq Ft
$191/Sq Ft
Est. Value
About This Home
This home is located at 1610 Delgany St, Columbus, OH 43228 and is currently estimated at $258,884, approximately $191 per square foot. 1610 Delgany St is a home located in Franklin County with nearby schools including West Franklin Elementary School, Franklin Woods Intermediate School, and Finland Middle School.
Ownership History
Date
Name
Owned For
Owner Type
Purchase Details
Closed on
Apr 22, 2024
Sold by
Garrett Megan and Garrett Evan
Bought by
Garrett Megan and Garrett Evan
Current Estimated Value
Home Financials for this Owner
Home Financials are based on the most recent Mortgage that was taken out on this home.
Original Mortgage
$209,605
Outstanding Balance
$206,419
Interest Rate
6.79%
Mortgage Type
FHA
Estimated Equity
$52,465
Purchase Details
Closed on
Apr 13, 2020
Sold by
Garrett Crystal L and Garrett Terrance E
Bought by
Garrett Megan
Home Financials for this Owner
Home Financials are based on the most recent Mortgage that was taken out on this home.
Original Mortgage
$134,055
Interest Rate
4.12%
Mortgage Type
FHA
Purchase Details
Closed on
Sep 14, 1987
Bought by
Garrett Terrance E
Create a Home Valuation Report for This Property
The Home Valuation Report is an in-depth analysis detailing your home's value as well as a comparison with similar homes in the area
Home Values in the Area
Average Home Value in this Area
Purchase History
| Date | Buyer | Sale Price | Title Company |
|---|---|---|---|
| Garrett Megan | -- | Amrock | |
| Garrett Megan | $155,000 | Title Connect | |
| Garrett Terrance E | $67,000 | -- |
Source: Public Records
Mortgage History
| Date | Status | Borrower | Loan Amount |
|---|---|---|---|
| Open | Garrett Megan | $209,605 | |
| Previous Owner | Garrett Megan | $134,055 |
Source: Public Records
Tax History Compared to Growth
Tax History
| Year | Tax Paid | Tax Assessment Tax Assessment Total Assessment is a certain percentage of the fair market value that is determined by local assessors to be the total taxable value of land and additions on the property. | Land | Improvement |
|---|---|---|---|---|
| 2024 | $2,704 | $74,170 | $22,510 | $51,660 |
| 2023 | $2,656 | $74,165 | $22,505 | $51,660 |
| 2022 | $2,513 | $51,490 | $10,920 | $40,570 |
| 2021 | $2,563 | $51,490 | $10,920 | $40,570 |
| 2020 | $2,549 | $51,490 | $10,920 | $40,570 |
| 2019 | $2,311 | $41,200 | $9,100 | $32,100 |
| 2018 | $2,233 | $41,200 | $9,100 | $32,100 |
| 2017 | $2,290 | $41,200 | $9,100 | $32,100 |
| 2016 | $2,165 | $35,780 | $7,600 | $28,180 |
| 2015 | $2,165 | $35,780 | $7,600 | $28,180 |
| 2014 | $2,167 | $35,780 | $7,600 | $28,180 |
| 2013 | $1,193 | $39,725 | $8,435 | $31,290 |
Source: Public Records
Map
Nearby Homes
- 3766 Dunlane Ct
- 1612 Green Friar Dr
- 3728 Greenock Ct
- 1485 Demorest Rd
- 4419 Hammerton Dr Unit 13D
- 1830 Winding Hollow Dr
- 1599 Covina Dr
- 3814 Clime Rd
- 4655 Parkwick Dr
- 3623 High Creek Dr
- 4359 Honeywood Ct
- 4483 White Leaf Way
- 2157 Hierarch Ct
- 1842 Bashan Dr Unit 75F
- 3488 Rocky Rd
- 1865 Bashan Dr Unit 78E
- 4253 Demorest Cove Ct
- 4459 Amwood St
- 3728 Miltonsburg Dr
- 4650 Parrau Dr Unit 67E
- 1602 Delgany St
- 1616 Delgany St
- 1623 Demorest Rd
- 1594 Delgany St
- 1619 Demorest Rd
- 1624 Delgany St
- 4002 Donegal Ct
- 1609 Delgany St
- 1613 Demorest Rd
- 1588 Delgany St
- 1589 Delgany St
- 1609 Demorest Rd
- 1621 Delgany St
- 4016 Londonderry Ave
- 4031 Londonderry Ave
- 1582 Delgany St
- 1603 Demorest Rd
- 4022 Londonderry Ave
- 3802 Dunlane Ct
- 1637 Demorest Rd