Estimated Value: $117,000 - $138,000
2
Beds
1
Bath
864
Sq Ft
$146/Sq Ft
Est. Value
About This Home
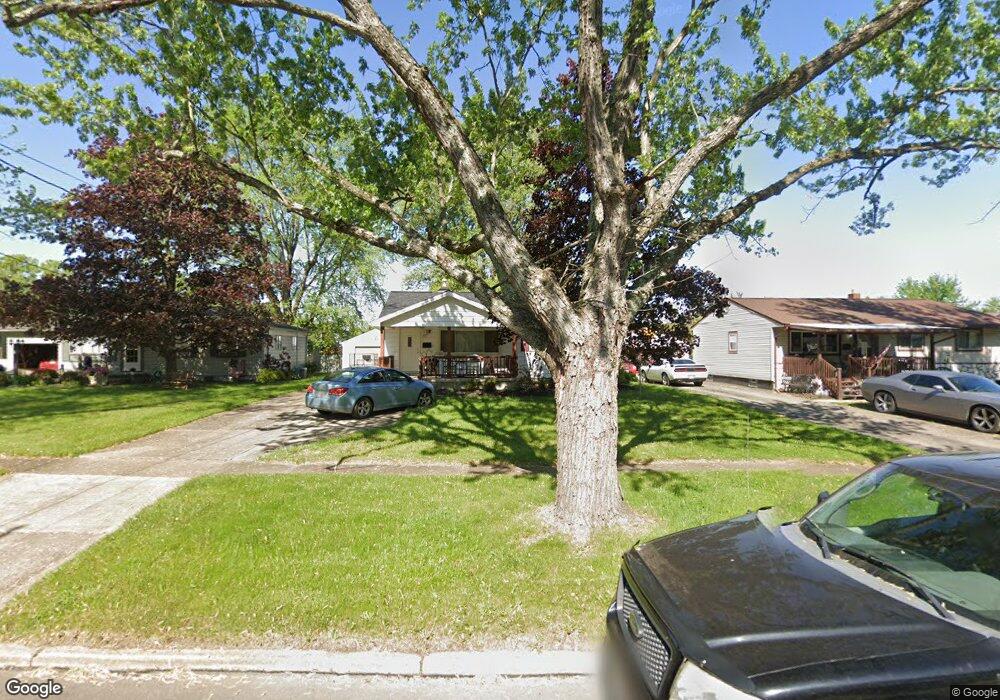
This home is located at 1610 Difford Dr, Niles, OH 44446 and is currently estimated at $126,033, approximately $145 per square foot. 1610 Difford Dr is a home located in Trumbull County with nearby schools including Howland High School, Summit Academy Community School - Warren, and Niles Preparatory Academy.
Ownership History
Date
Name
Owned For
Owner Type
Purchase Details
Closed on
Jun 28, 2005
Sold by
Jones Marvin C
Bought by
Mcarthur Melany J
Current Estimated Value
Home Financials for this Owner
Home Financials are based on the most recent Mortgage that was taken out on this home.
Original Mortgage
$78,561
Outstanding Balance
$41,304
Interest Rate
5.87%
Mortgage Type
FHA
Estimated Equity
$84,729
Purchase Details
Closed on
Mar 6, 2005
Sold by
Jones Betty A
Bought by
Jones Marvin C
Home Financials for this Owner
Home Financials are based on the most recent Mortgage that was taken out on this home.
Original Mortgage
$78,561
Interest Rate
5.87%
Mortgage Type
FHA
Purchase Details
Closed on
Jan 1, 1990
Bought by
Marvin C Jones
Create a Home Valuation Report for This Property
The Home Valuation Report is an in-depth analysis detailing your home's value as well as a comparison with similar homes in the area
Home Values in the Area
Average Home Value in this Area
Purchase History
| Date | Buyer | Sale Price | Title Company |
|---|---|---|---|
| Mcarthur Melany J | $79,800 | -- | |
| Jones Marvin C | -- | -- | |
| Marvin C Jones | -- | -- |
Source: Public Records
Mortgage History
| Date | Status | Borrower | Loan Amount |
|---|---|---|---|
| Open | Mcarthur Melany J | $78,561 | |
| Previous Owner | Jones Marvin C | $78,561 |
Source: Public Records
Tax History
| Year | Tax Paid | Tax Assessment Tax Assessment Total Assessment is a certain percentage of the fair market value that is determined by local assessors to be the total taxable value of land and additions on the property. | Land | Improvement |
|---|---|---|---|---|
| 2024 | $1,328 | $29,580 | $5,080 | $24,500 |
| 2023 | $1,317 | $29,580 | $5,080 | $24,500 |
| 2022 | $1,084 | $21,150 | $5,080 | $16,070 |
| 2021 | $1,085 | $21,150 | $5,080 | $16,070 |
| 2020 | $1,089 | $21,150 | $5,080 | $16,070 |
| 2019 | $1,031 | $19,050 | $5,080 | $13,970 |
| 2018 | $1,021 | $19,050 | $5,080 | $13,970 |
| 2017 | $902 | $19,050 | $5,080 | $13,970 |
| 2016 | $950 | $19,570 | $5,080 | $14,490 |
| 2015 | $939 | $19,570 | $5,080 | $14,490 |
| 2014 | $901 | $19,570 | $5,080 | $14,490 |
| 2013 | $936 | $20,480 | $5,080 | $15,400 |
Source: Public Records
Map
Nearby Homes
- 1503 Gypsy Ln
- 1407 Gypsy Ln
- 1323 Old Forge Rd
- 1414 Niles Cortland Rd
- 2564 Niles Cortland Rd SE
- 1004 N Bentley Ave
- 869 Frederick St
- 850 Vienna Ave
- 270 North Rd
- 245 North Rd
- 3702 Hightree Ave SE
- 3824 Valacamp Ave SE
- 145 North Rd
- 820 Hartzell Ave
- 1486 Tripodi Cir
- 812 Hartzell Ave
- 0 Harrison St
- 4464 Willow Creek Dr SE
- 0 Hughes St SE
- 4256 Youngstown Rd SE
- 1612 Difford Dr
- 1608 Difford Dr
- 1614 Difford Dr
- 1609 Morris Place
- 1606 Difford Dr
- 1611 Morris Place
- 1607 Morris Place
- 1613 Morris Place
- 1616 Difford Dr
- 1604 Difford Dr
- 1607 Difford Dr
- 1605 Morris Place
- 1605 Difford Dr
- 1609 Difford Dr
- 1615 Morris Place
- 1603 Difford Dr
- 1618 Difford Dr
- 1611 Difford Dr
- 1602 Difford Dr
- 1601 Difford Dr
Your Personal Tour Guide
Ask me questions while you tour the home.