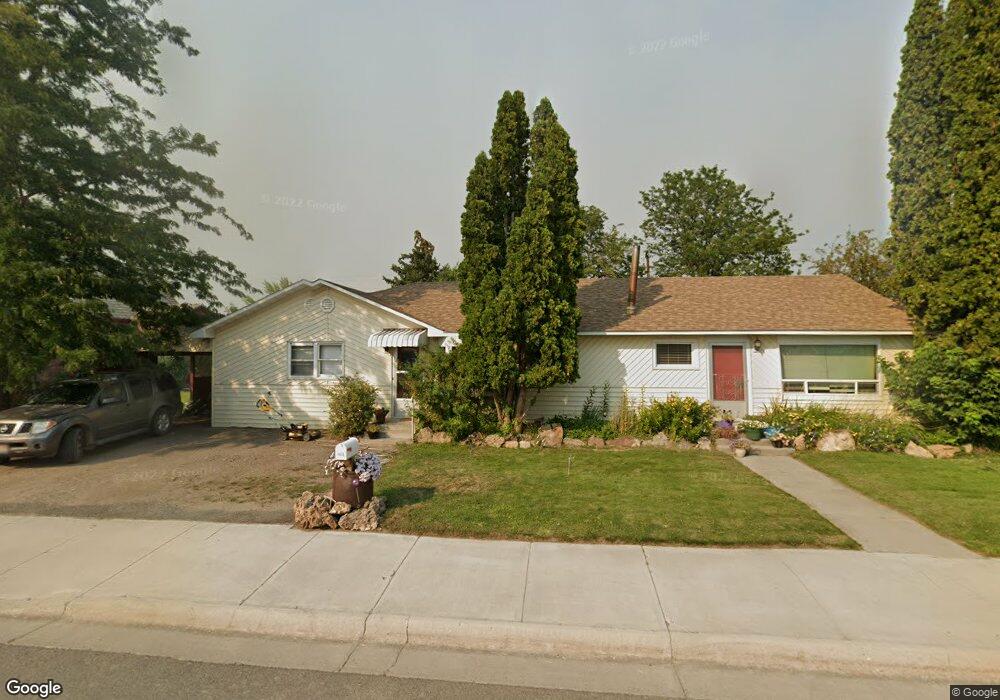
1610 Main St Salmon, ID 83467
Estimated Value: $377,000 - $496,000
3
Beds
2
Baths
2,492
Sq Ft
$180/Sq Ft
Est. Value
About This Home
This home is located at 1610 Main St, Salmon, ID 83467 and is currently estimated at $448,053, approximately $179 per square foot. 1610 Main St is a home located in Lemhi County with nearby schools including Salmon Pioneer Primary School, Salmon Jr./Sr. High School, and Fern-Waters Public Charter School.
Ownership History
Date
Name
Owned For
Owner Type
Purchase Details
Closed on
Jul 21, 2021
Sold by
Cope Robert E and Cope Terry L
Bought by
Jackson Revin S
Current Estimated Value
Home Financials for this Owner
Home Financials are based on the most recent Mortgage that was taken out on this home.
Original Mortgage
$290,000
Outstanding Balance
$242,850
Interest Rate
2.96%
Mortgage Type
Commercial
Estimated Equity
$205,203
Create a Home Valuation Report for This Property
The Home Valuation Report is an in-depth analysis detailing your home's value as well as a comparison with similar homes in the area
Home Values in the Area
Average Home Value in this Area
Purchase History
| Date | Buyer | Sale Price | Title Company |
|---|---|---|---|
| Jackson Revin S | -- | Lemhi Title Co |
Source: Public Records
Mortgage History
| Date | Status | Borrower | Loan Amount |
|---|---|---|---|
| Open | Jackson Revin S | $290,000 |
Source: Public Records
Tax History
| Year | Tax Paid | Tax Assessment Tax Assessment Total Assessment is a certain percentage of the fair market value that is determined by local assessors to be the total taxable value of land and additions on the property. | Land | Improvement |
|---|---|---|---|---|
| 2025 | $3,176 | $512,269 | $131,080 | $381,189 |
| 2024 | $3,211 | $512,269 | $131,080 | $381,189 |
| 2023 | $2,062 | $420,987 | $96,125 | $324,862 |
| 2022 | $2,238 | $409,430 | $84,568 | $324,862 |
| 2021 | $2,653 | $293,158 | $65,843 | $227,315 |
| 2020 | $1,966 | $261,102 | $54,248 | $206,854 |
| 2019 | $2,131 | $261,102 | $54,248 | $206,854 |
| 2018 | $2,096 | $257,667 | $52,711 | $204,956 |
| 2017 | $2,179 | $257,667 | $52,711 | $204,956 |
| 2016 | $2,204 | $240,264 | $52,711 | $187,553 |
| 2013 | $1,816 | $180,256 | $38,965 | $141,291 |
| 2011 | $1,816 | $195,631 | $35,470 | $160,161 |
Source: Public Records
Map
Nearby Homes
- 901 Main St
- NKN U S 93
- TBD Jeffery Ln
- 407 Lena St
- NKN Cinnabar Cir
- 233 Obsidian Dr
- 322 N Saint Charles St
- 406 S Terrace St
- 109 Lena St
- 334 Catherine Ln
- 315 Riverfront Dr
- TBD St Charles St
- 701 N St Charles St
- 2 Chaffin Ln
- 114 Neyman St
- 5 Demick Ln
- 409 Lombard St
- 319 Snook St
- TBD Easy St
- 405 Washington St
Your Personal Tour Guide
Ask me questions while you tour the home.