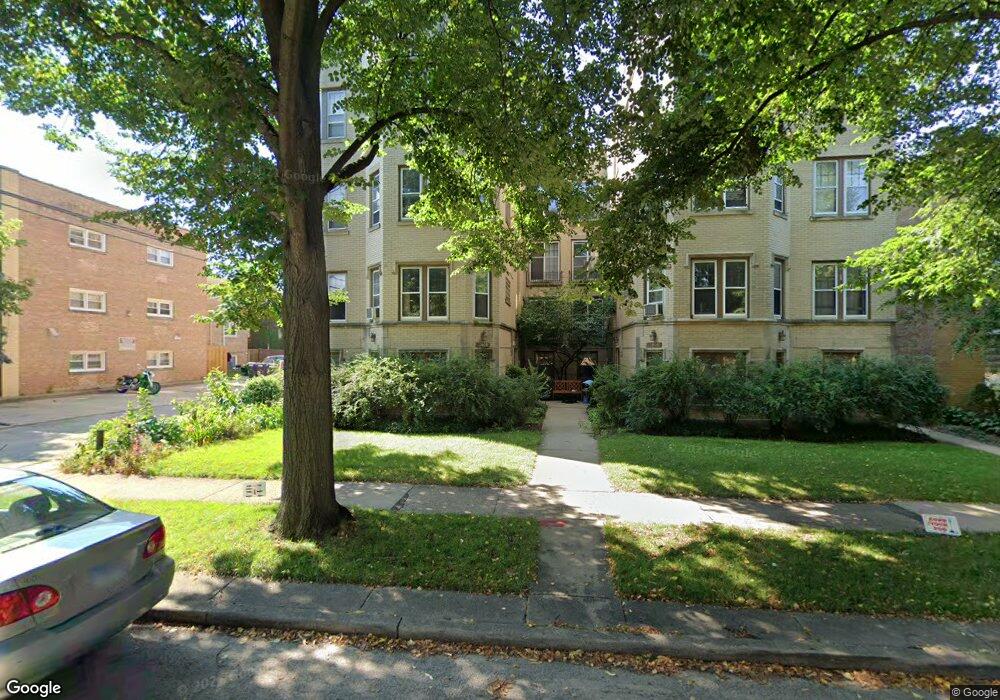
1610 Monroe St Unit 16102E Evanston, IL 60202
Estimated Value: $147,000 - $215,000
1
Bed
--
Bath
750
Sq Ft
$237/Sq Ft
Est. Value
About This Home
This home is located at 1610 Monroe St Unit 16102E, Evanston, IL 60202 and is currently estimated at $177,935, approximately $237 per square foot. 1610 Monroe St Unit 16102E is a home located in Cook County with nearby schools including Dawes Elementary School, Chute Middle School, and Evanston Township High School.
Ownership History
Date
Name
Owned For
Owner Type
Purchase Details
Closed on
Aug 31, 2004
Sold by
Beneficial Illinois Inc
Bought by
Radloff William
Current Estimated Value
Home Financials for this Owner
Home Financials are based on the most recent Mortgage that was taken out on this home.
Original Mortgage
$112,000
Outstanding Balance
$55,672
Interest Rate
5.93%
Mortgage Type
Unknown
Estimated Equity
$122,263
Purchase Details
Closed on
Feb 2, 2004
Sold by
Volberding Jane A
Bought by
Beneficial Illinois Inc and Beneficial Mortgage Co Of Illinois
Purchase Details
Closed on
Jun 4, 1996
Sold by
Melanie Sovine Melanie and Melanie Solvine
Bought by
Volberding Jane A
Home Financials for this Owner
Home Financials are based on the most recent Mortgage that was taken out on this home.
Original Mortgage
$68,495
Interest Rate
7.97%
Create a Home Valuation Report for This Property
The Home Valuation Report is an in-depth analysis detailing your home's value as well as a comparison with similar homes in the area
Home Values in the Area
Average Home Value in this Area
Purchase History
| Date | Buyer | Sale Price | Title Company |
|---|---|---|---|
| Radloff William | $129,000 | First American Title | |
| Beneficial Illinois Inc | -- | Chicago Title Insurance Comp | |
| Volberding Jane A | $72,500 | -- |
Source: Public Records
Mortgage History
| Date | Status | Borrower | Loan Amount |
|---|---|---|---|
| Open | Radloff William | $112,000 | |
| Previous Owner | Volberding Jane A | $68,495 |
Source: Public Records
Tax History Compared to Growth
Tax History
| Year | Tax Paid | Tax Assessment Tax Assessment Total Assessment is a certain percentage of the fair market value that is determined by local assessors to be the total taxable value of land and additions on the property. | Land | Improvement |
|---|---|---|---|---|
| 2024 | $1,867 | $10,926 | $1,192 | $9,734 |
| 2023 | $1,766 | $10,926 | $1,192 | $9,734 |
| 2022 | $1,766 | $10,926 | $1,192 | $9,734 |
| 2021 | $1,083 | $7,358 | $867 | $6,491 |
| 2020 | $1,129 | $7,358 | $867 | $6,491 |
| 2019 | $1,137 | $8,220 | $867 | $7,353 |
| 2018 | $1,547 | $9,006 | $722 | $8,284 |
| 2017 | $1,522 | $9,006 | $722 | $8,284 |
| 2016 | $1,668 | $9,006 | $722 | $8,284 |
| 2015 | $2,162 | $10,572 | $596 | $9,976 |
| 2014 | $2,501 | $11,854 | $596 | $11,258 |
| 2013 | $2,427 | $11,854 | $596 | $11,258 |
Source: Public Records
Map
Nearby Homes
- 704 Florence Ave
- 1810 Washington St
- 1408 Seward St
- 532 Wesley Ave Unit WEST
- 647 Asbury Ave
- 604 Dodge Ave
- 1810 South Blvd
- 1916 Keeney St
- SAN JUAN GRANDE La Cascabela
- 1927 Warren St
- 419 Florence Ave
- 553 Barton Ave
- 401 Dewey Ave
- 347 Florence Ave
- 1114 Main St Unit 1W
- 1025 Wesley Ave
- 1037 Dodge Ave
- 1021 South Blvd
- 835 Ridge Ave Unit 207
- 835 Ridge Ave Unit 507
- 1610 Monroe St Unit 1E
- 1610 Monroe St Unit 5
- 1610 Monroe St Unit 16101
- 1610 Monroe St Unit 16103E
- 1610 Monroe St Unit 3W
- 1610 Monroe St Unit 2W
- 1612 Monroe St Unit 6
- 1612 Monroe St Unit 4
- 1612 Monroe St Unit 1
- 1612 Monroe St Unit 3
- 1612 Monroe St Unit 1610-3W
- 1614 Monroe St Unit 16142E
- 1612 Monroe St Unit 1610-2W
- 1614 Monroe St Unit 16143E
- 1614 Monroe St Unit 2
- 1614 Monroe St Unit 16142W
- 1614 Monroe St Unit 16141
- 1614 Monroe St Unit 16143W
- 1614 Monroe St Unit 3E
- 1614 Monroe St Unit 2W